The HXD-V1 is monitored and operated from the same desktop control app as the HXB-V1. The dryer screens are included from app version 2.1.0. This chapter covers registering the dryer in the app, the screens, reading the alarm tables and exporting records. The daily start and stop order and what to watch while it runs are in [the Operation chapter](/handbook/hxd-v1/operation/).
- AppSame control app as the HXB-V1, 2.1.0 or later
- ScreensHome · Dashboard · P&ID · Alarms & Events
First timeFollow the device and project sections, then look over the screens.
Done this beforeGo to reading the alarm and event tables.
On this pageInstallation and connection
Installation and connection#
Installing the app and setting up the control PC's network are the same as for the HXB-V1. Connect the HXD-V1 Ethernet to the same network as the control PC. Versions below 2.1.0 have no dryer screens, so get the latest version.
Registering the unit and creating a project#
- The app opens on Project Manager. Click Devices.
- Choose HXD as the Device Type, enter the Device ID exactly as on the unit's label, and click Add.
- Click New Project, enter a project name, choose the registered HXD-V1 under Devices, and click Create.
- Click Start on the project in the list and confirm with Start Project.
- CheckMQTT ONLINE and the unit status (Status) appear at the top of the app. If it shows OFFLINE, check power and Ethernet.
The screens#
- Header
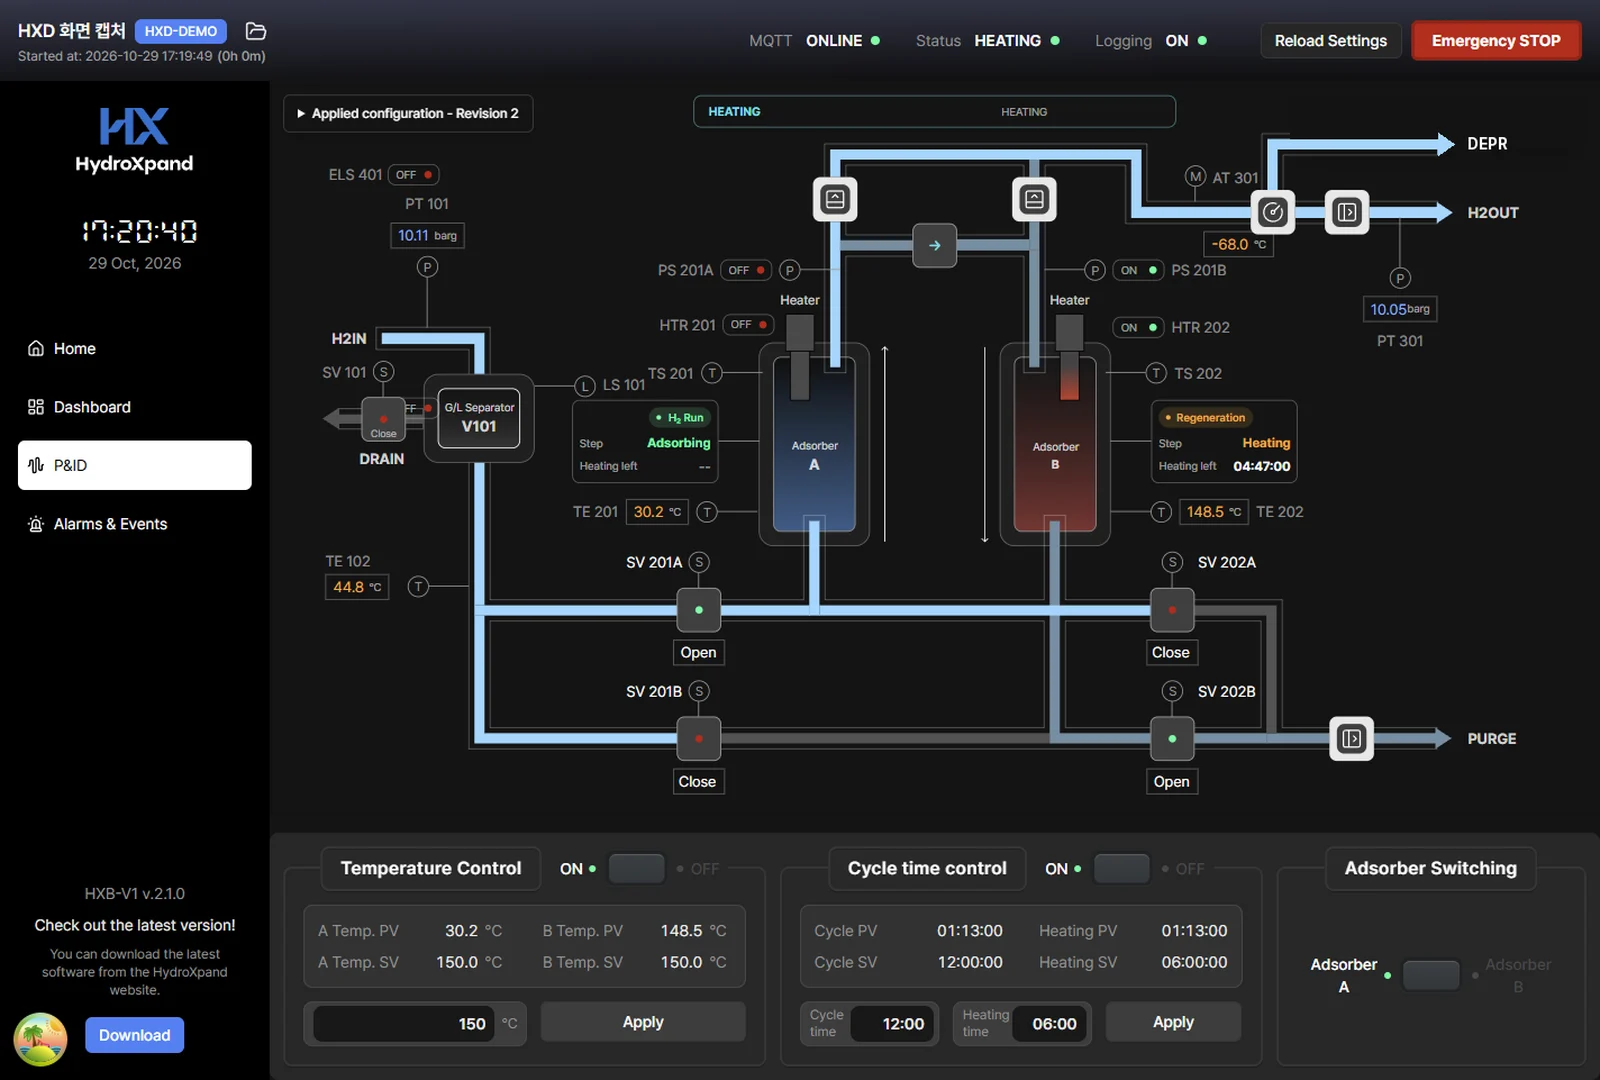
- MQTT connection, unit status (Status), logging (Logging) and the Emergency STOP button
- Home
- Today's and the current session's operating summary, and a safety snapshot of active alarms
- Dashboard
- Adsorber A and B temperature and H2 IN and H2 OUT pressure charts, with minimum, maximum and average for the period
- P&ID
- Readings and valve states on the process diagram, and the regeneration step of each tower. Below it: Temperature Control, Cycle time control and Adsorber Switching
- Alarms & Events
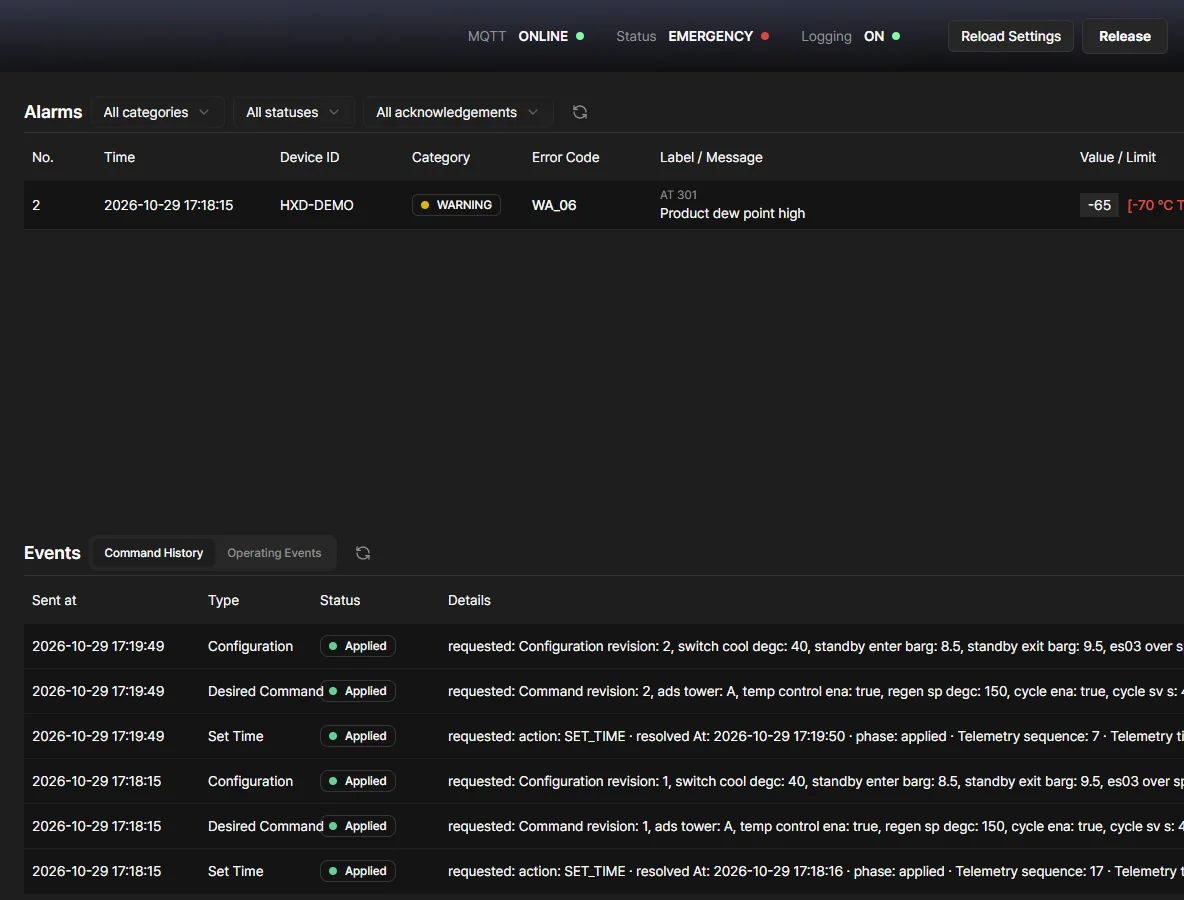
- The alarm list (code, reading, limit and status), the history of commands sent, and operating events
Reading the alarm and event tables#
The top of the Alarms & Events screen is the alarm table and the bottom is the event table. Alarms are abnormal conditions that need attention; events are the history of commands sent and of what happened during operation. The refresh icon updates the tables.
| Alarm column | Meaning |
|---|---|
| No. | Alarm number |
| Time | When the alarm was raised |
| Device ID | The dryer that raised it, when the project has more than one unit |
| Category | Level: EMERGENCY STOP, FAULT STOP or WARNING |
| Error Code | The ES, FS or WA code. Find the same code in the alarm tables |
| Label / Message | The small text is the tag of the sensor or part that raised it (as on the P&ID screen); below it is what is abnormal |
| Value / Limit | The actual value against the alarm limit |
| Status | Whether it is still Active or has been Resolved |
| Ack | The acknowledge button. Pressing it records when the alarm was acknowledged |
The three lists above the table filter by level, status and acknowledgement.
| Event tab | What it holds |
|---|---|
| Command History | Settings and commands the app sent: Sent at, Type, Status and Details. The status is Sent, Applied, Rejected or Timeout |
| Operating Events | What happened during operation: automatic switch delayed or completed, manual switch executed or refused, STANDBY entered or recovered, and so on |
Exporting records#
While Logging at the top of the app is ON, operating data is recorded to the project continuously. Export the records as csv.
- Open Project Manager.
- In the options menu (⋯) of the project, choose Telemetry Only (.csv).
- Choose HXD as the Device type and a Sampling interval from 1 second to 30 minutes.
- Pick where to save it. The file is named project-name-hxd-telemetry-interval-s.csv.
The csv holds, with timestamps, the regeneration step and online tower, the regeneration settings, tower temperatures, inlet and outlet pressure, dew point, valve, heater and fan states, the emergency-stop cause, alarms and the firmware version.
What this chapter is based on
- HXD-V1 datasheetPDF · 3.2 MB
- HXD-V1 outline drawingPDF · 368 KB
- First start checklistPDF · 61 KB
- Routine check sheetPDF · 66 KB
- Maintenance logPDF · 49 KB
- HXD-V1 user manualPDF · 2.7 MB
Thank you. We read every answer.
Tell us what was missing and we will fix this page. Tell us what was missing →
Ask the engineer who built it
If your case is not covered here, send us the operating condition and what you observed. The engineer who designed the system answers directly.