The HXB-V1 is operated from the HXB HMI desktop app. This chapter is a reference organised by screen: installation and connection, projects, what each screen shows and what you do there, reading the alarm and event tables, protocols, and exporting your records.
The start-up and shutdown sequences are in the operation and control chapter, and what each alarm means and what to do is in the troubleshooting chapter. This chapter also points you to those sections.
- AppHXB HMI desktop app
- ConnectionDirect Ethernet cable to the PC
- RecordsLogged automatically · export to csv
First timeDo the installation and project sections first; the unit only appears in the app once both are done. The rest is reference to look up with the app in front of you.
Done this beforeFind the screen you are looking at in the screen table. If an alarm is showing, go to the alarms and events section.
On this pageInstallation and connection
Installation and connection
- The app
- It ships with the system. Ask us if you need the latest version.
- PC network
- Set a static IP: address 192.168.121.4, subnet mask 255.255.255.0. The address is the same for every HXB-V1. To run several units from one PC, tell us when you order: we set a different static IP on each unit before shipping and give you the address list.
- Cable
- Connect the PC directly to the unit with an Ethernet cable.
Projects
Opening the app brings up Project Manager first. Operating records accumulate per project, and you export per project too. Keeping a separate project for each test or run makes records easy to find later.
- Click New Project.
- Enter the project details.
- Project name and an optional description
- Device ID, exactly as printed on the label on the rear panel
- Click Create, then click Start on that project in the list.
- Check the connection and logging on the top bar.
- MQTT showing ONLINE means the app is connected to the unit.
- Logging must be ON for operating data to be recorded.
The screens
The tabs sit in the left-hand menu in working order. The actual controls are on the P&ID screen; the other screens are for watching.
| Screen | What is on it | When to use it |
|---|---|---|
| Home | A summary for the day and for the current session (run time, hydrogen produced, average power, specific energy) and the Safety Snapshot, a list of recent alarms | Checking the safety state before start-up |
| Dashboard | Trend charts for stack voltage and current, electrolyte temperature, hydrogen production and hydrogen pressure, with the time window switchable between seconds, minutes, hours and days | Watching stability and performance while running |
| P&ID | Sensor readings shown on a diagram of the tank, circulation path and stack, with the Electrolyte Control and Power Control panels | Applying setpoints, starting and stopping |
| Alarms & Events | The alarm table and the event (command history) table | When an alarm appears, or to confirm a command went through |
| Protocols | Automated sequences for repeatable tests | Repeating the same test |
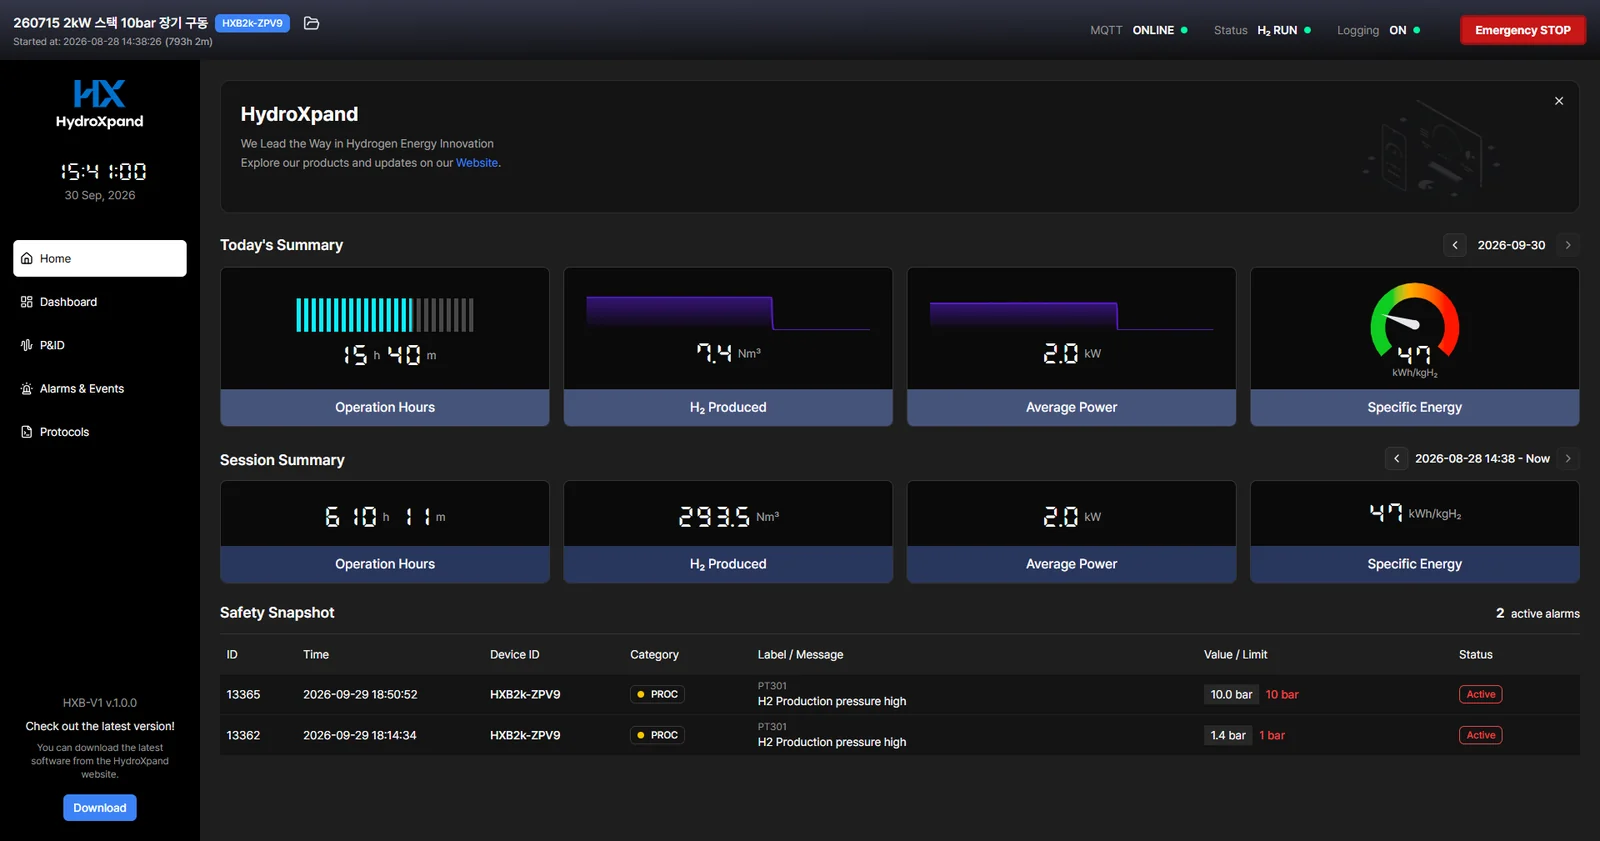
Top bar
- MQTT
- Whether the app is connected to the unit. It should read ONLINE
- Status
- Whether the unit is running or stopped
- Logging
- Logging state. It should read ON
- Emergency STOP
- Immediate shutdown. Pressing it once also releases an emergency stop
Where you operate: P&ID and Dashboard
To start, switch on Electrolyte Control on the P&ID first, then Power Control once circulation and temperature are stable. Stopping is the reverse. On each panel, enter the target values and click Apply for them to take effect.
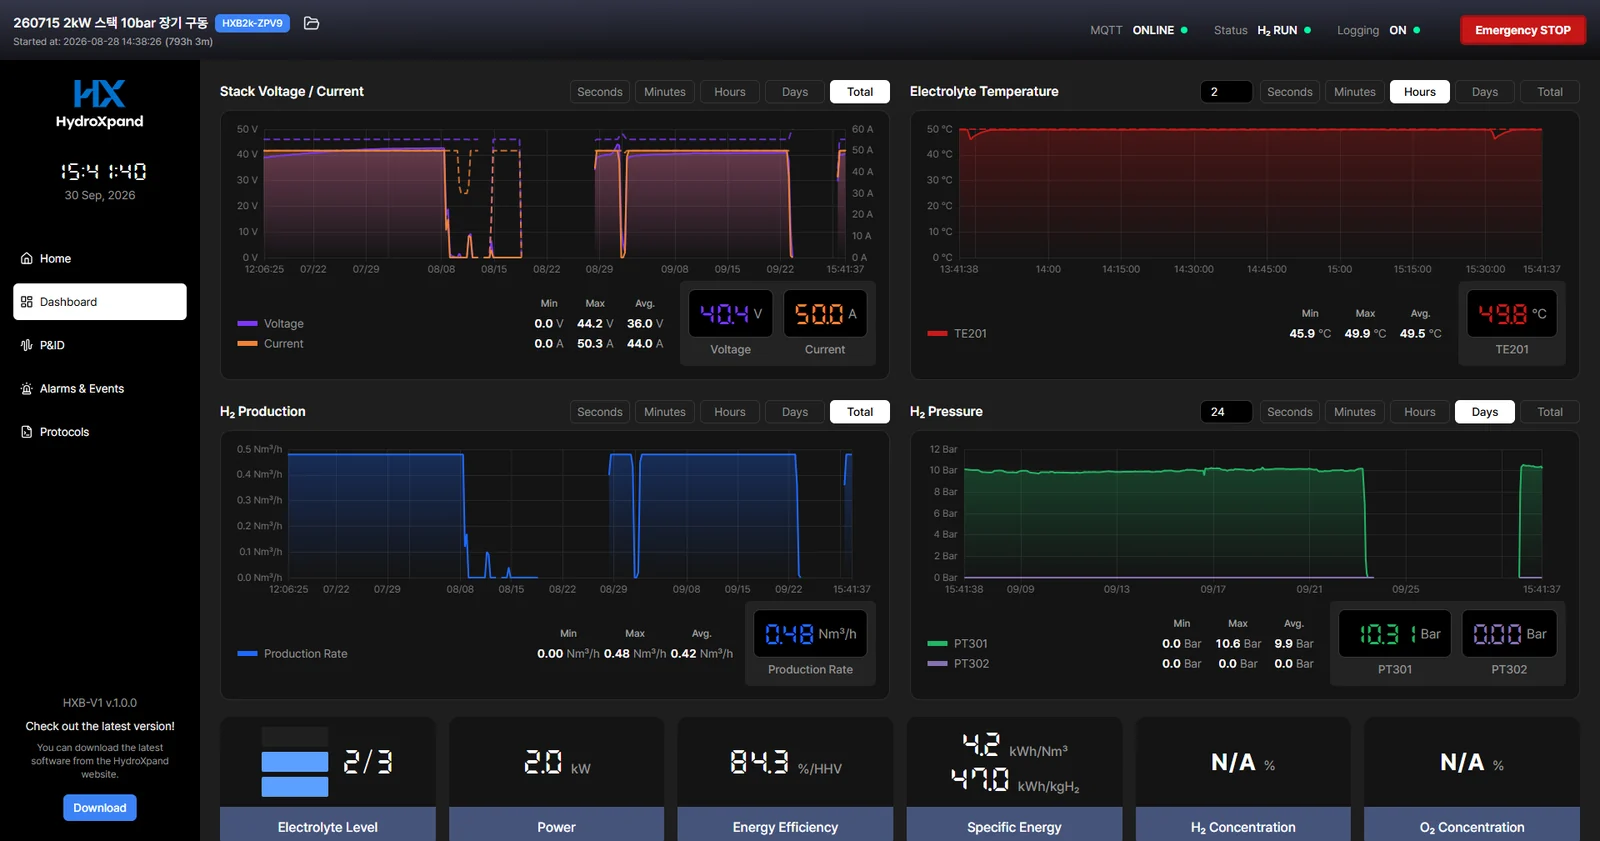
- Stack voltage and current respond to the targets and stay steady.
- Electrolyte level stays in the normal range.
- Electrolyte flow stays stable near the setpoint.
- Electrolyte temperature moves toward the setpoint and settles.
Reading the alarm and event tables
The Alarms & Events screen holds two tables. Alarms are abnormal conditions that need attention; Events are the history of commands and actions. The refresh icon updates the tables.
| Alarm column | Meaning |
|---|---|
| ID | Alarm identifier |
| Time | When the alarm was raised |
| Category | Where it came from: SAF safety, PROC process, EQUIP equipment or actuator, COMM communication |
| Label | The tag of the sensor or part that raised it, matching the tag on the P&ID screen |
| Message | What is abnormal |
| Value / Limit | The actual value against the alarm limit |
| Status | Whether it is still active or has been resolved |
| Event column | Meaning |
|---|---|
| ID | Event identifier |
| Time | When it was recorded |
| Type | Event type |
| Action | The command or action recorded |
| Status | The status of that command or action |
Protocols
Used for repeatable sequences such as ramp-and-hold tests and long runs. A protocol is a list of steps executed from top to bottom, with four kinds of step available.
- Electrolyte Control
- On or off, with temperature and flow setpoints
- Power Control
- On or off, with voltage and current setpoints
- Delay
- A wait
- Loop
- Repeat a section
Exporting records
While the PC is connected and Logging is ON, operating data is recorded continuously. The records accumulate in the project and are exported as csv.
- Open Project Manager.
- Select the project to export.
- Export from the project options menu (⋯) and download the csv file.
What this chapter is based on
- HXB-V1 datasheetPDF · 2.1 MB
- HXB-V1 outline drawingPDF · 1.9 MB
- HXB-V1 user manualOn request
Ask the engineer who built it
If your case is not covered here, send us the operating condition and what you observed. The engineer who designed the system answers directly.