Two electrolyzers quoted at 75% and 64% can be the same machine. Efficiency figures move with the heating value basis, the measurement boundary, the current density and the age of the stack, and this is how to read one properly.
Efficiency is the number every electrolyzer is sold on, and the number that is hardest to compare between suppliers. Not because anyone is being dishonest, but because a single percentage carries four hidden choices, and two suppliers can make those choices differently and both be correct.
Three constants sit behind every figure
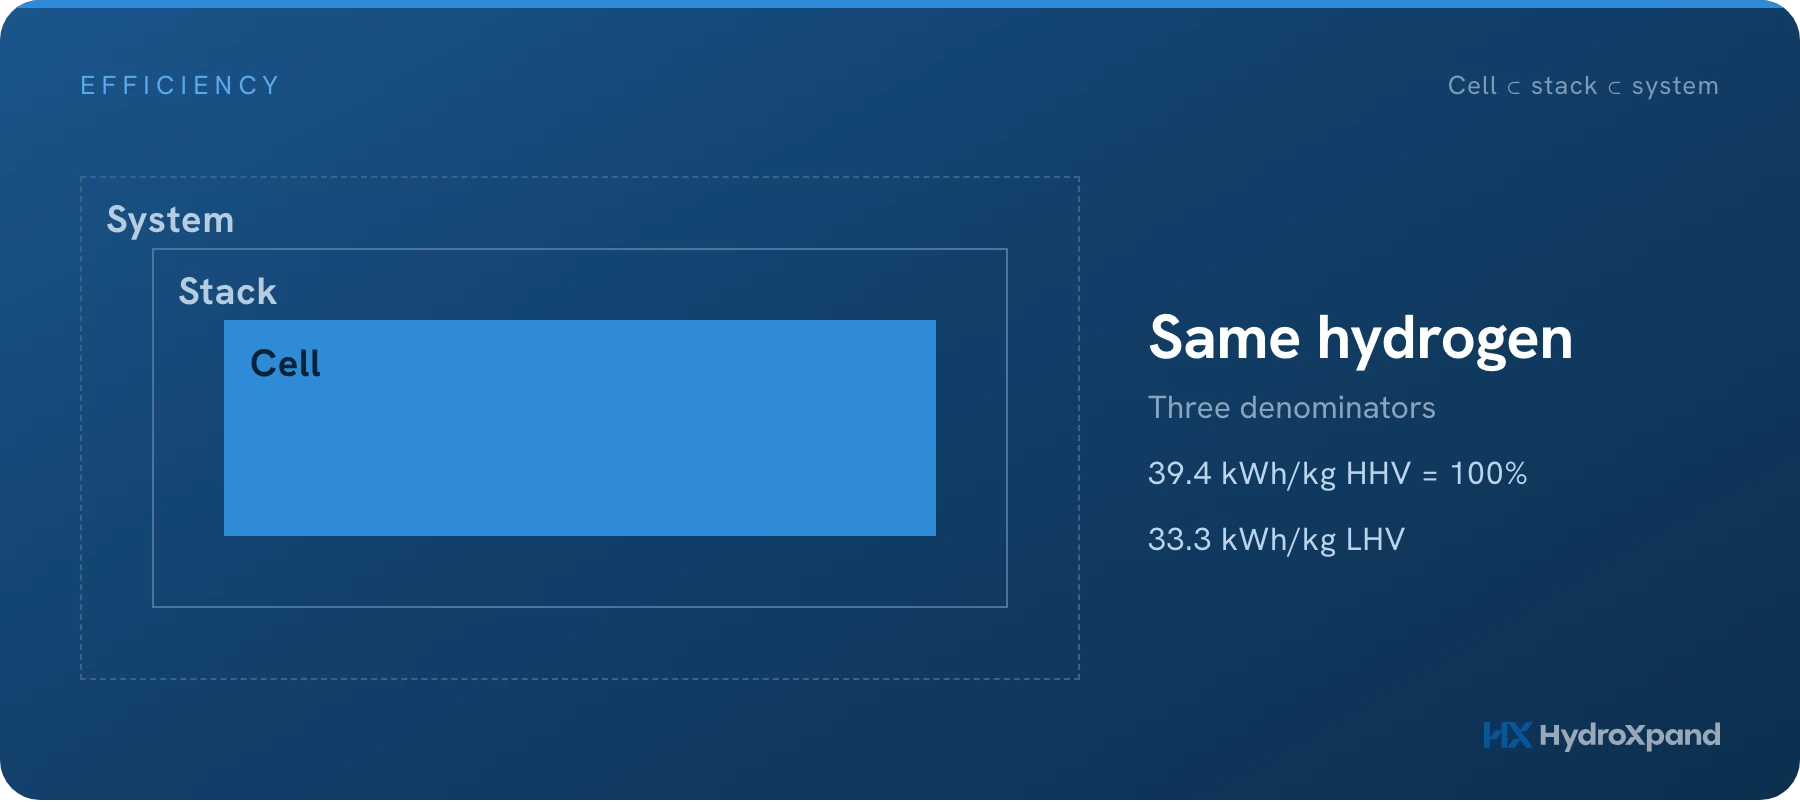
Below 1.48 V a cell absorbs heat from its surroundings to keep the reaction going. Above it, the cell produces heat. That voltage is where the HHV basis comes from, and every efficiency percentage you will ever be quoted is a comparison against one of the first two numbers.
For standard temperature of 25 °C, HHV is 285.8 kJ/mole H2, which corresponds to a thermodynamic minimum cell voltage of 1.48 V to split water.
SourcesNREL, Summary of Electrolytic Hydrogen Production (2004), Appendix B: 39.4 and 33.3 kWh/kg · Ginsberg et al., Solar RRL 2022: 1.48 V thermoneutral voltage
Which heating value, and which unit
Because 39.4 divided by 33.3 is about 1.18, the same machine reads roughly 18% higher on an HHV basis than on an LHV basis. A system at 64% LHV is at about 76% HHV. Neither figure is wrong and both describe identical hardware.
| Unit | What it measures | Direction |
|---|---|---|
| kWh/kg | Electricity consumed per kilogram of hydrogen | Lower is better |
| Percentage | Heating value divided by energy consumedAgainst HHV 39.4 or LHV 33.3 kWh/kg | Higher is better |
| kWh/Nm³ | Per normal cubic metre1 Nm³ is about 0.0899 kg, so multiply by 11.1 for kWh/kg | Lower is better |
A percentage without its heating value basis is not a specification.
Where the number was measured
A cell figure is one MEA in a test fixture. There is no plumbing, no neighbouring cells and no shared electrolyte loop, so nothing drags it down. It is the highest number any supplier can show, and it is a materials result rather than a product result.
A system figure adds the rectifier, the circulation pumps, gas separation, drying and the controls. It is the only one of the three that corresponds to the electricity your meter records. We quote our own stack efficiency on a stack boundary and say so.
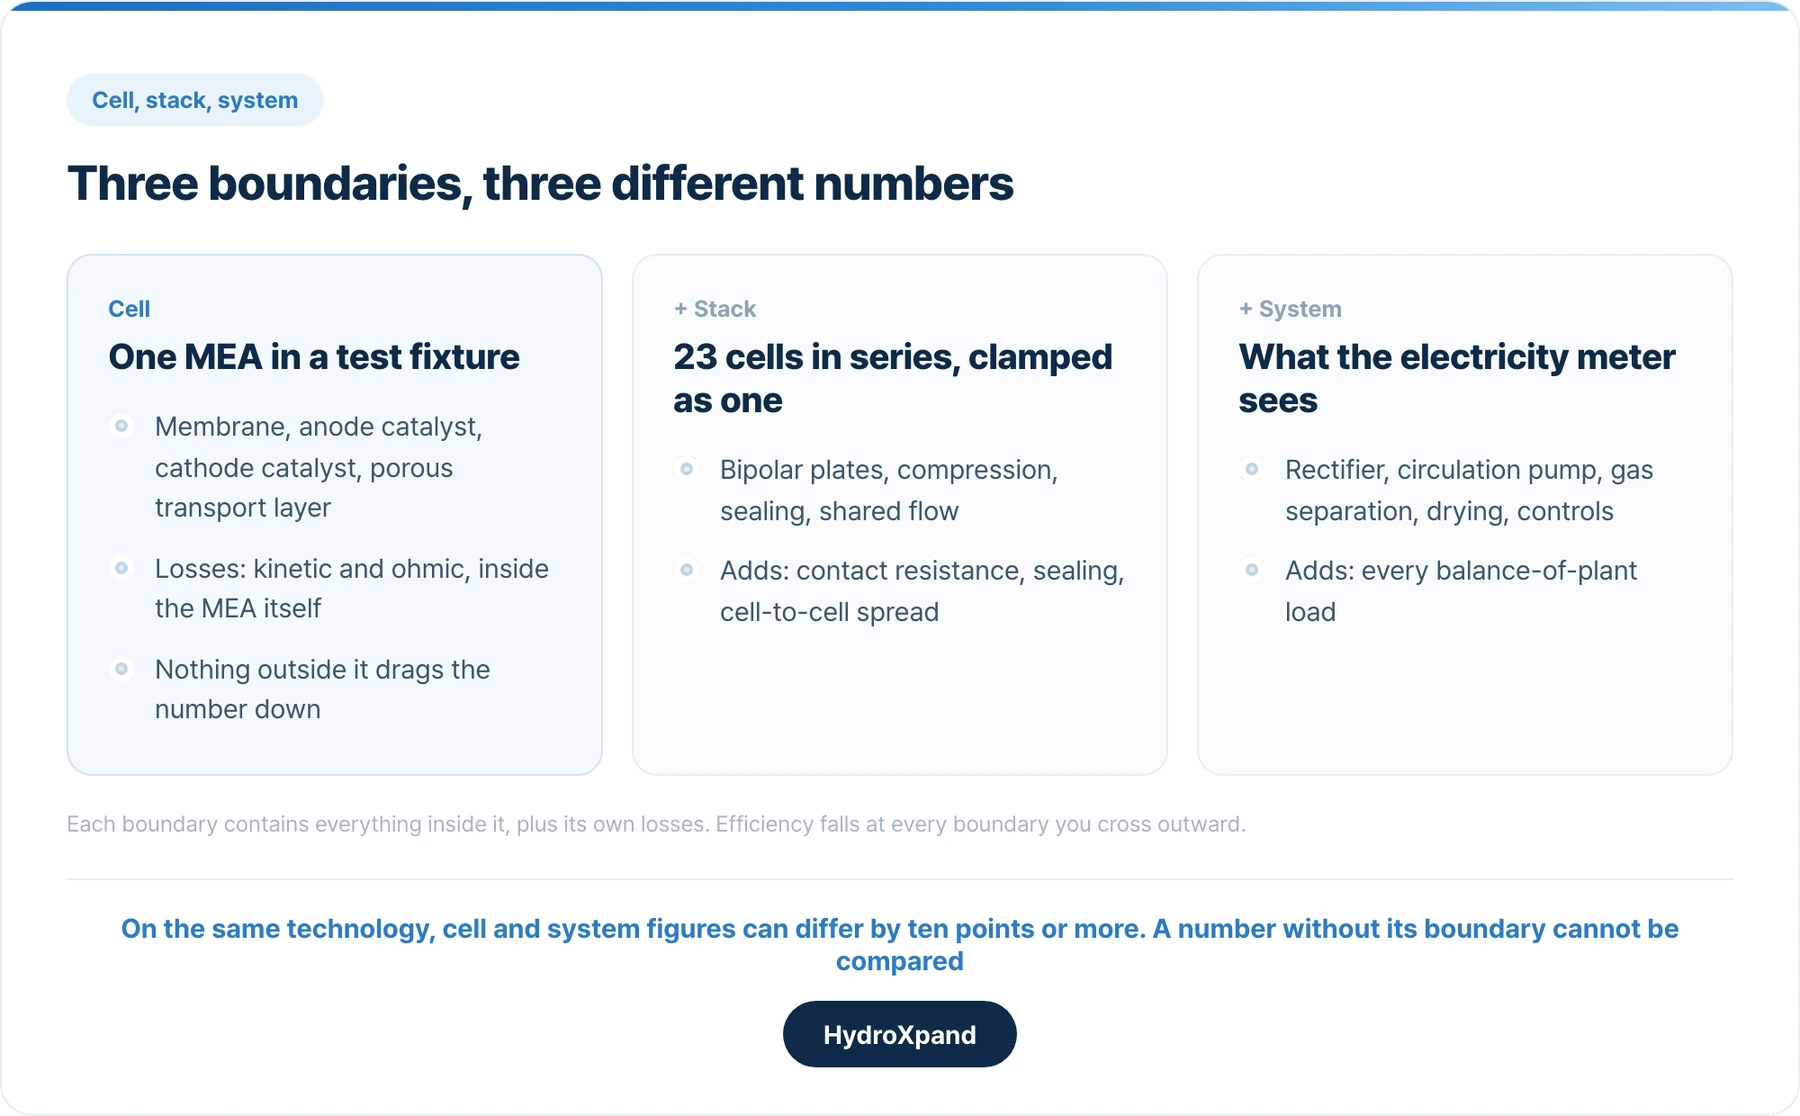
None of the three is a dishonest number. They answer different questions. The problem is only when a cell figure from one supplier is set beside a system figure from another.
- HXS-2 · 2 kW stack→Measured cell voltage and the conditions it was taken under.
- Durability note→The long-run HXS-2 data, with the test conditions.
- Datasheets→Six products. No form.
At what load, and at what age
Efficiency in electrolysis rises as you run the cell softer. Lower current density means lower overpotential, so a stack at half its rated current is more efficient per kilogram than the same stack at rated current, and produces correspondingly less hydrogen per unit of capital. Quoting efficiency without the current density leaves out the trade the designer actually made.
Temperature moves the number the same way, so a figure at 60 °C and a figure at 40 °C on the same hardware are not the same claim. Age moves it too: every electrolyzer degrades, and a specification that does not say which point on that curve it quotes is quoting beginning of life.
SourceIRENA, Green Hydrogen Cost Reduction (2020), chapter 2: efficiency rises at lower-than-design load
Four questions that make two figures comparable
- Is it HHV or LHV? About 18% of difference on the same hardware.
- Is it cell, stack or system? Only the system figure matches your meter.
- At what current density and temperature? Efficiency rises as a cell is run softer.
- Beginning of life, or after how many hours? Every stack degrades.
If a supplier can answer all four without checking, that tells you something about how the number was produced. If the answers are not on the datasheet they should be available on request, and a supplier who will not put them in writing has told you what the number is worth.
Our own numbers, with their conditions
The 90.0% is a stack figure on an HHV basis, not a system figure, and the conditions row is there because the number means nothing without it.
We do not convert operating hours into a product lifetime. A separate technical note sets out what to check alongside a long-run curve, including cell-to-cell spread and crossover behaviour.
That stack is a product, not a laboratory sample. The HXS-2 is a 23-cell 2 kW AEM water electrolyzer stack rated at 480 NL/h (1 kg/day), available to order and shipping four weeks from PO acceptance.
| Item | Disclosed condition |
|---|---|
| Stack | HXS-2, 23 cells |
| Efficiency | 90.0% HHV at beginning of life |
| Efficiency conditions | Stack boundary, 50 A, 0.1 M KOH, 50 °C, ambient pressure |
| Operation | More than 3,000 hours cumulative |
| Long-run data | Published with its test conditions in the durability note |
| Pressure | Up to 10 barg on the hydrogen side |
SourcesU.S. DOE Technical Targets for Liquid Alkaline Electrolysis: 2022 status stack 51 and system 55 kWh/kg · U.S. DOE Technical Targets for PEM Electrolysis
- AEM electrolysis: technology and measured data→How AEM electrolysis works, AEM vs PEM vs alkaline, and the measured data behind our stacks.
- What pressurised operation costs→28 mV per cell at 50 A, and the crossover measurements that set the real lower bound on load.
- HXS-2 durability data→The long-run curve, the cell-to-cell spread and the crossover behaviour, with every condition attached.
- What is an electrolyzer stack→Why a stack figure sits below a cell figure, and what happens between the two.
- Alkaline, PEM or AEM→Where an efficiency figure sits among the things that actually decide a technology choice.
- What water electrolysis is→The four fixed numbers per kg, and why the energy floor cannot be quoted away.
- What the hydrogen colours leave out→Where a kWh/kg figure turns into a carbon intensity, and the thresholds it is measured against.
- Is AEM proven?→The shorter record, our published run with its conditions, and what it does not cover.
Frequently asked questions
Why can two electrolyzers quoted at 75% and 64% be the same machine?
Because efficiency moves with the heating value basis, the measurement boundary, the current density and the age of the stack. The same hardware reads about 18% higher relative on an HHV basis than on LHV.
What is the theoretical minimum energy to make 1 kg of hydrogen?
39.4 kWh per kg on a higher heating value basis, or 33.3 kWh per kg on a lower heating value basis. 1.48 V per cell is the thermoneutral voltage where electricity alone covers the full enthalpy.
What efficiency does HydroXpand publish?
90.0% HHV at the HXS-2 stack at beginning of life, which corresponds to about 44 kWh per kg. The HXB-V1 system draws about 56 kWh per kg at the wall because the balance of plant adds about 12 kWh per kg.
Sources
- Summary of Electrolytic Hydrogen Production, NREL/MP-560-36734 — National Renewable Energy Laboratory, 2004
- Integrating Solar Energy, Desalination, and Electrolysis (DOI 10.1002/solr.202100732) — Solar RRL, 2022
- Green Hydrogen Cost Reduction — International Renewable Energy Agency, 2020
- Technical Targets for Liquid Alkaline Electrolysis — U.S. Department of Energy
- Technical Targets for Proton Exchange Membrane Electrolysis — U.S. Department of Energy
Looking at AEM for a specific application?