The hours in a durability report usually say how long a stack was tested, not how long it lasts. How to read operating hours and degradation rate together, which window the rate was fitted over, the voltage the run ended at, and the conditions to ask for.
One of the first questions we get from anyone evaluating a stack is how many hours it lasts. The answer usually comes back as a single number: 2,000 hours, 5,000 hours, 10,000 hours.
In many durability reports, that number says more about how long the stack was tested than how long it will last. Whether the cell was still healthy when the test stopped, or already close to unusable, cannot be read from the hours alone. This is the order we follow when we read someone else's durability data, and when we explain our own.
- Read operating hours together with the reason the test stopped and the cell voltage it ended at.
- To compare runs, use the degradation rate. Runs of different length can be compared by how fast the cell voltage rises, as long as the conditions match.
- A degradation rate depends on the window it was fitted over. Check whether the initial settling period is included, and whether the fit covers the whole run or only the later part.
- Check which cell the figure came from. The same electrode can give very different results with another membrane or other operating conditions.
What operating hours say, and what they do not
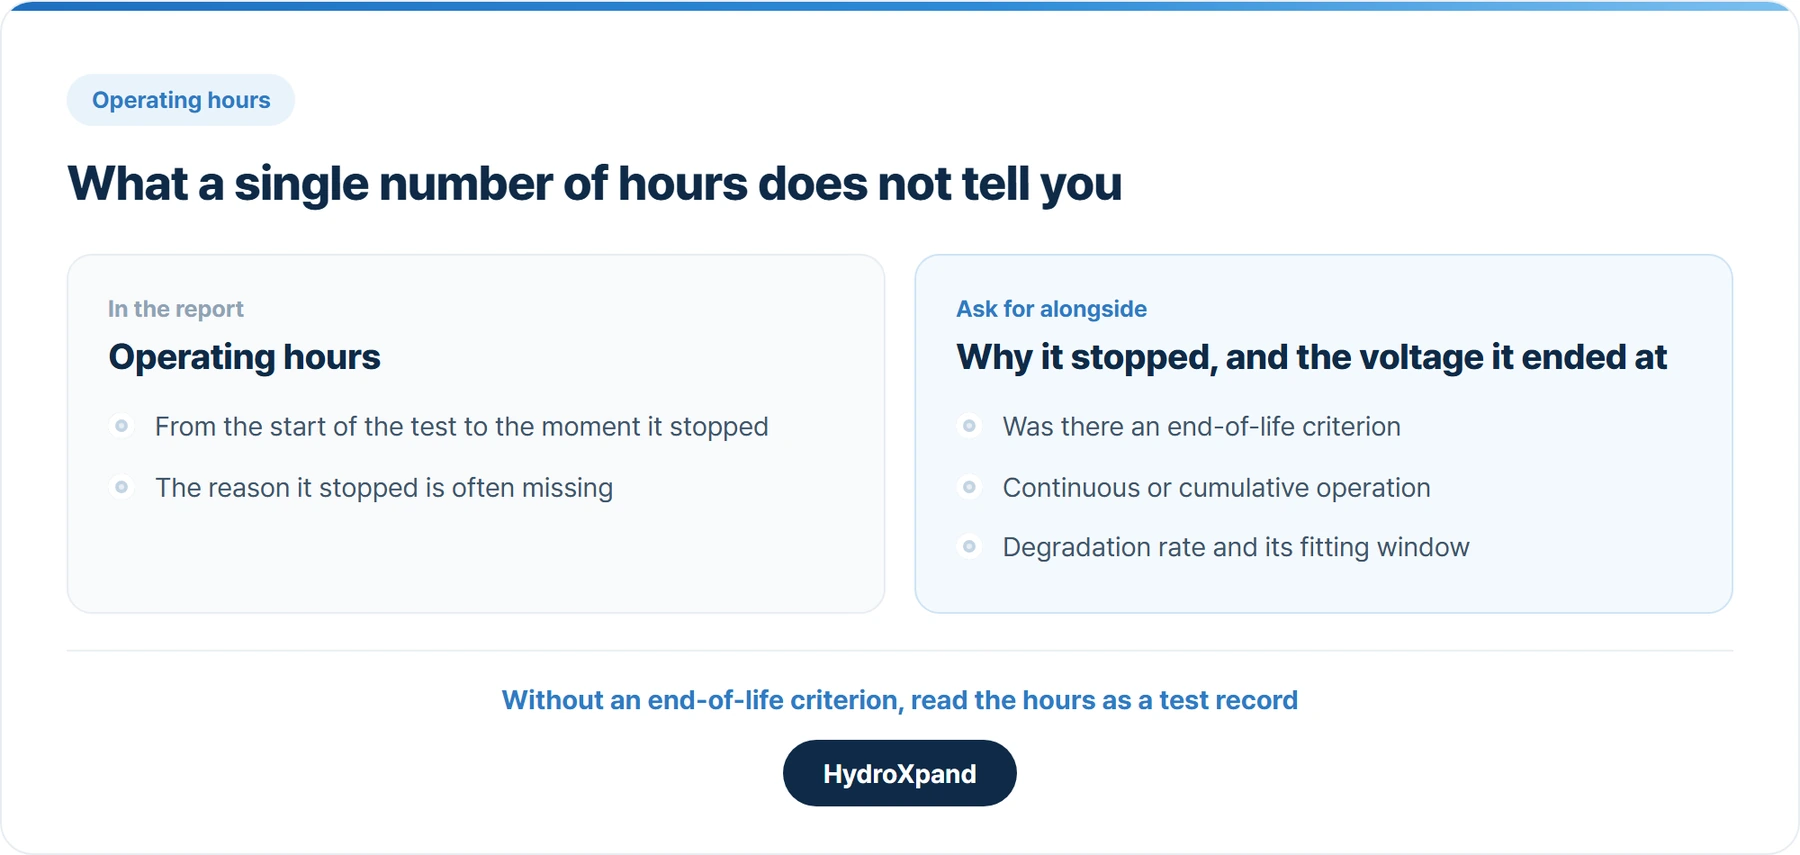
The hours in a durability report run from the start of a test to the moment it stopped. Tests stop for many reasons: the cell voltage climbed too far, the planned period ended, or the rig was needed for something else. In the first case the hours are close to a lifetime. In the others there is no way to know whether the cell could have gone further.
To state a lifetime in hours, an end-of-life criterion has to come first: how far the cell voltage may rise before the stack is considered finished. That criterion differs between suppliers and is often not written down. Without it, read the hours as a test record.
Check, too, whether the hours are continuous or cumulative. Continuous operation runs without stopping; cumulative operation adds up periods separated by shutdowns and restarts. The two give different numbers for the same cell, and stopping and restarting puts its own load on a cell.
Reading a degradation rate in µV/h
A degradation rate is how fast the cell voltage rises while the stack runs at a constant current. It is usually given per cell in microvolts per hour (µV/h). Because it is a rate, it can compare runs of different length, so it is the number to look at when two reports are set side by side.
A worked example. The numbers below are chosen for illustration and are not our measurements.
| Assumption | Value |
|---|---|
| Degradation rate per cell | 20 µV/h |
| Cell voltage rise after 1,000 hours | 20 mV |
| Efficiency (HHV) at a beginning-of-life cell voltage of 1.65 V | About 89.7% |
| Efficiency (HHV) after 1,000 hours at 1.67 V | About 88.6% |
A small-looking rate becomes an efficiency loss once the hours add up, and that loss shows up directly in the electricity bill over the operating period.
When you receive a degradation rate, check three things.
Per cell or per stack. In a 23-cell stack, 20 µV/h per cell is about 0.46 mV/h for the whole stack. Depending on whether the unit is µV/h or mV/h, and per cell or per stack, the same result can look up to a thousand times larger or smaller.
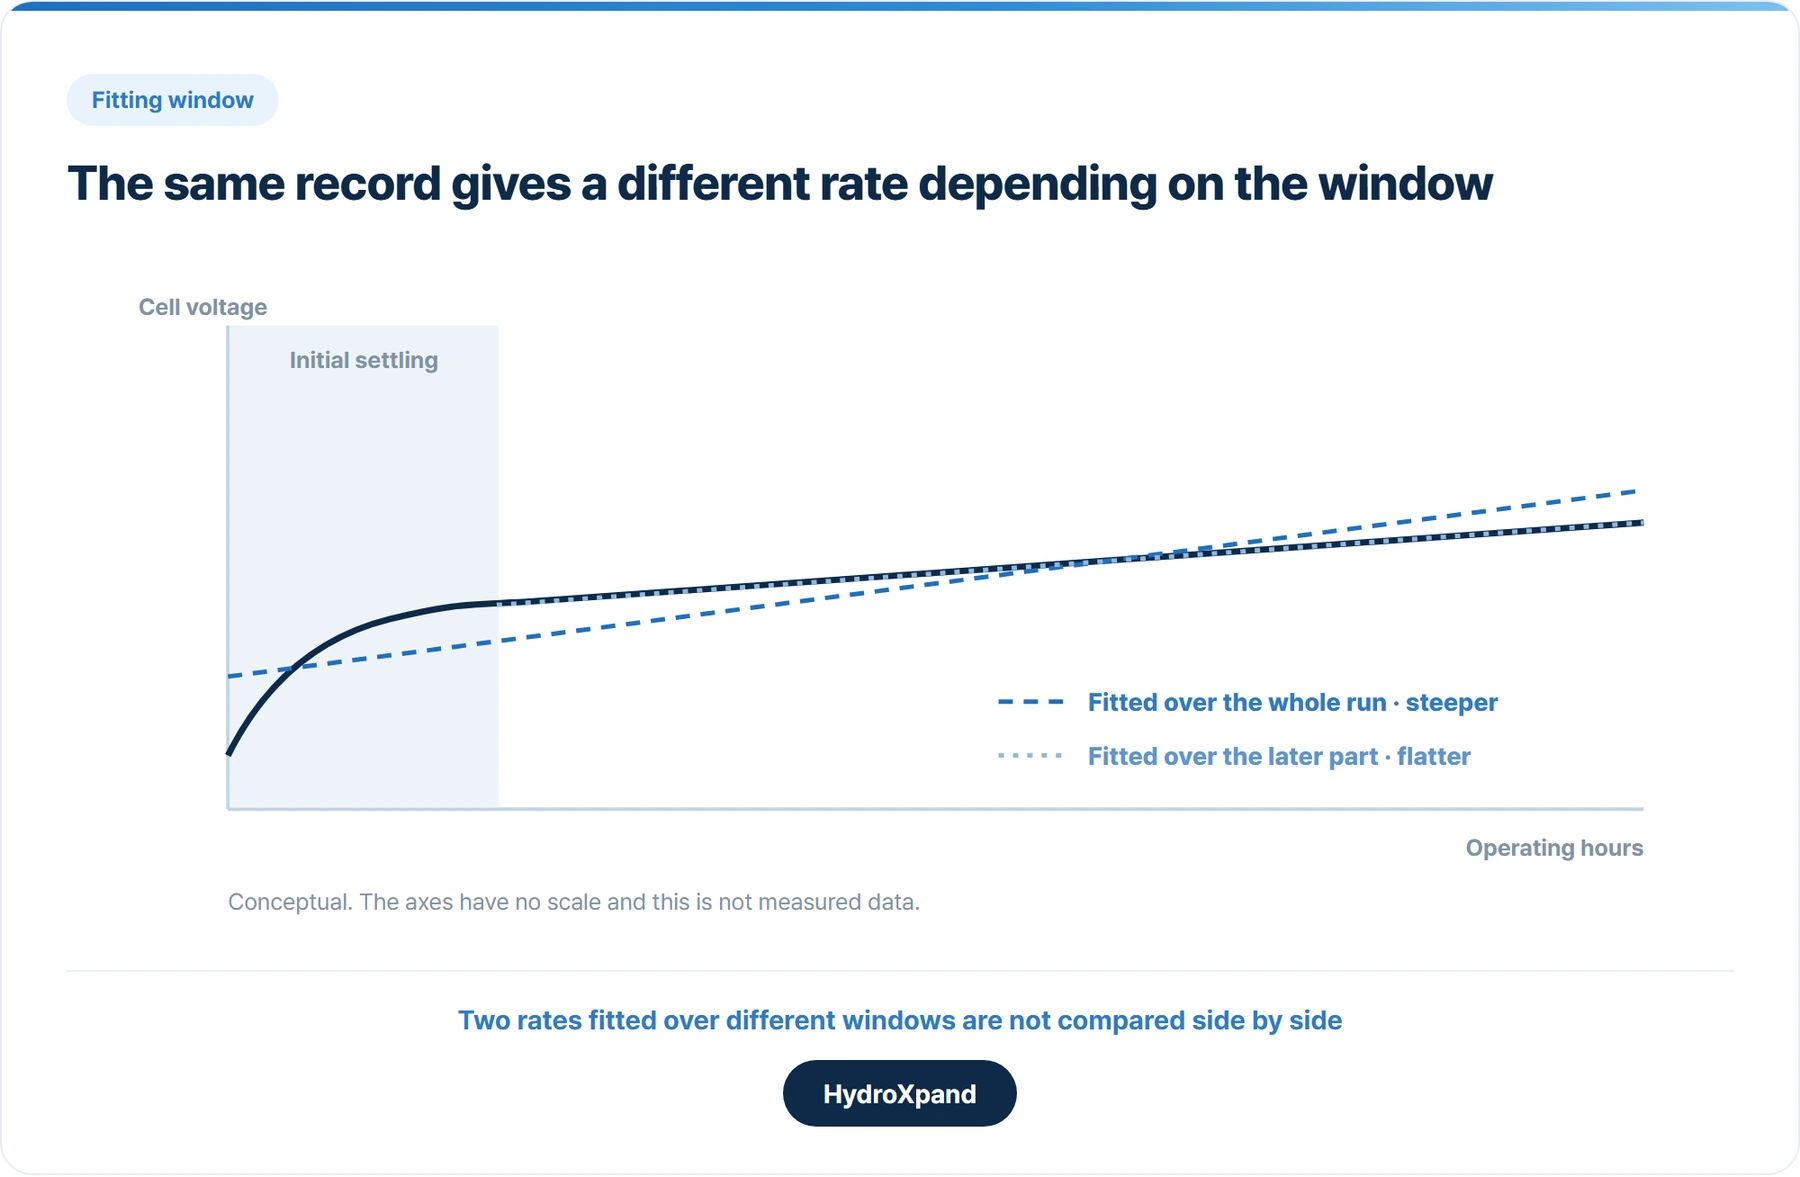
The fitting window. A freshly assembled cell moves quickly at first and then settles. Fit only the later part and the rate comes out smaller; fit the whole run including the settling period and it comes out larger. Neither is wrong, but two rates fitted over different windows cannot be set side by side.
Constant current. A degradation rate is normally calculated from the cell voltage recorded at a fixed current. A record with a changing load cannot be reduced to a rate in the same way.
Why the test conditions have to come with it
Like efficiency, a degradation rate moves with the conditions: current density, temperature, electrolyte concentration and outlet pressure. A single-cell result and a multi-cell stack result also differ. In a stack each cell sees slightly different electrolyte distribution and compression, and the weakest cell often sets the operating limit of the whole stack.
So ask for these alongside any durability figure:
| What to ask for | Why it matters |
|---|---|
| Operating mode and current density | Constant current or not, and at what current density |
| Temperature, electrolyte and concentration | The same cell degrades at a different rate under other conditions |
| Outlet pressure | Long-run behaviour under pressure has to be confirmed separately from ambient |
| Cell area and number of cells | Single-cell and stack results do not compare directly |
| Membrane and electrodes | The figure belongs to the whole cell, not to one component |
| Continuous or cumulative | How many shutdowns and restarts the run includes |
| Fitting window and final cell voltage | How fast it degraded, and where it ended |
Read hours with current density and voltage
The same number of hours means different things depending on the current density and cell voltage behind it. One published AEM run reached about 8,900 hours, more than a year. It was run at 0.2 A/cm², starting at 1.92 V and rising by about 18 µV per hour (Moreno-González et al., J. Power Sources Advances 19, 2023).
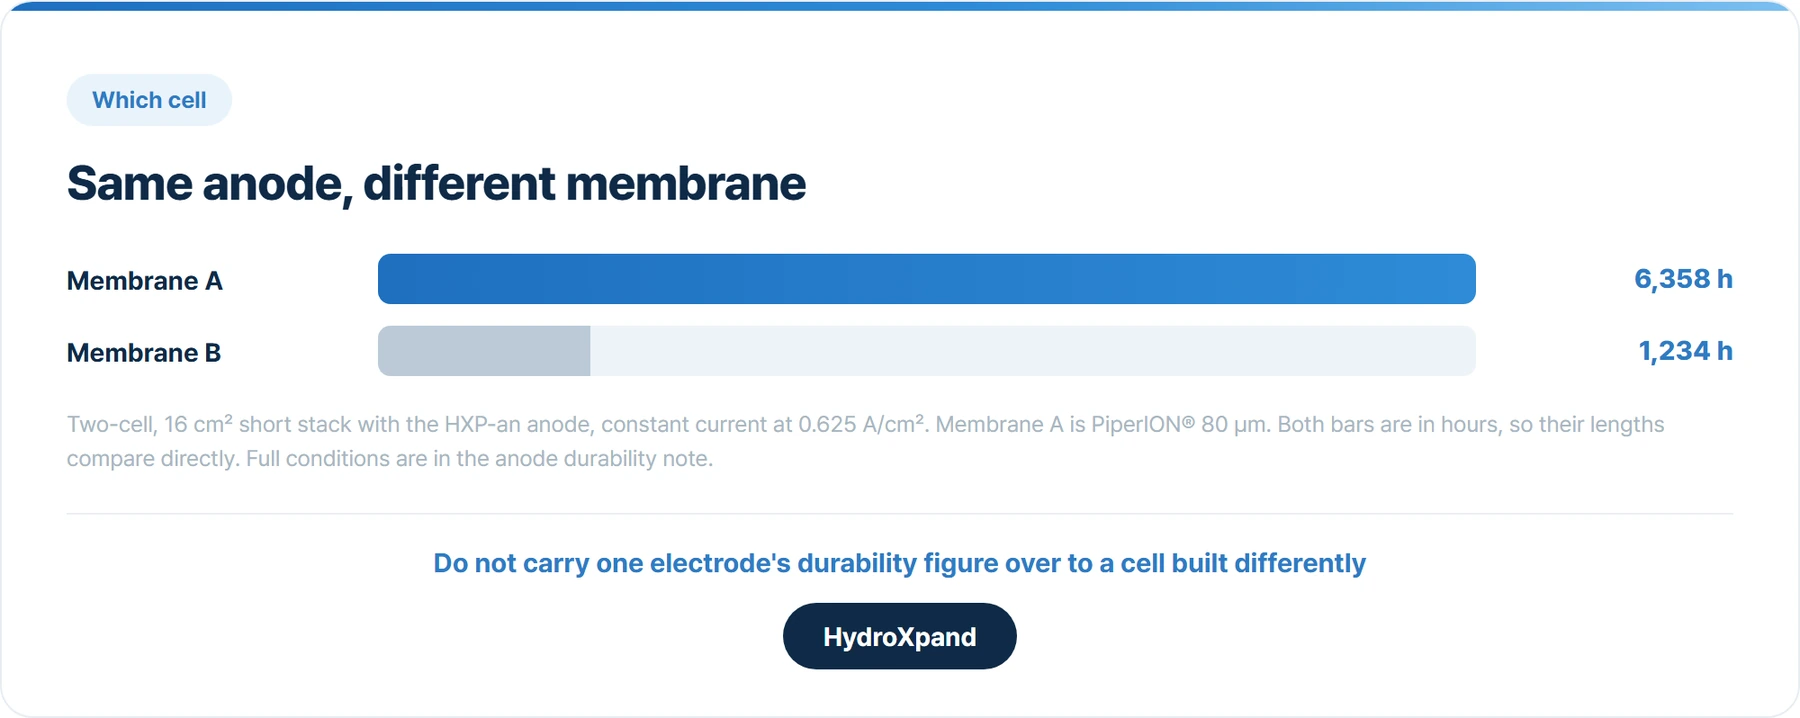
A two-cell, 16 cm² short stack built with our HXP-an anode and a PiperION 80 µm membrane ran for 6,358 hours at 0.625 A/cm², with the cell voltage rising from 1.893 V to 1.979 V. The current densities differ by more than a factor of three, so the two runs cannot be ranked on hours alone. The two tests also differ in laboratory, membrane, electrolyte and temperature; this is an example of how to read the numbers. (Corrected 11 October 2026: an earlier version misstated the conditions of the 8,900-hour run.)
Check which cell the figure came from
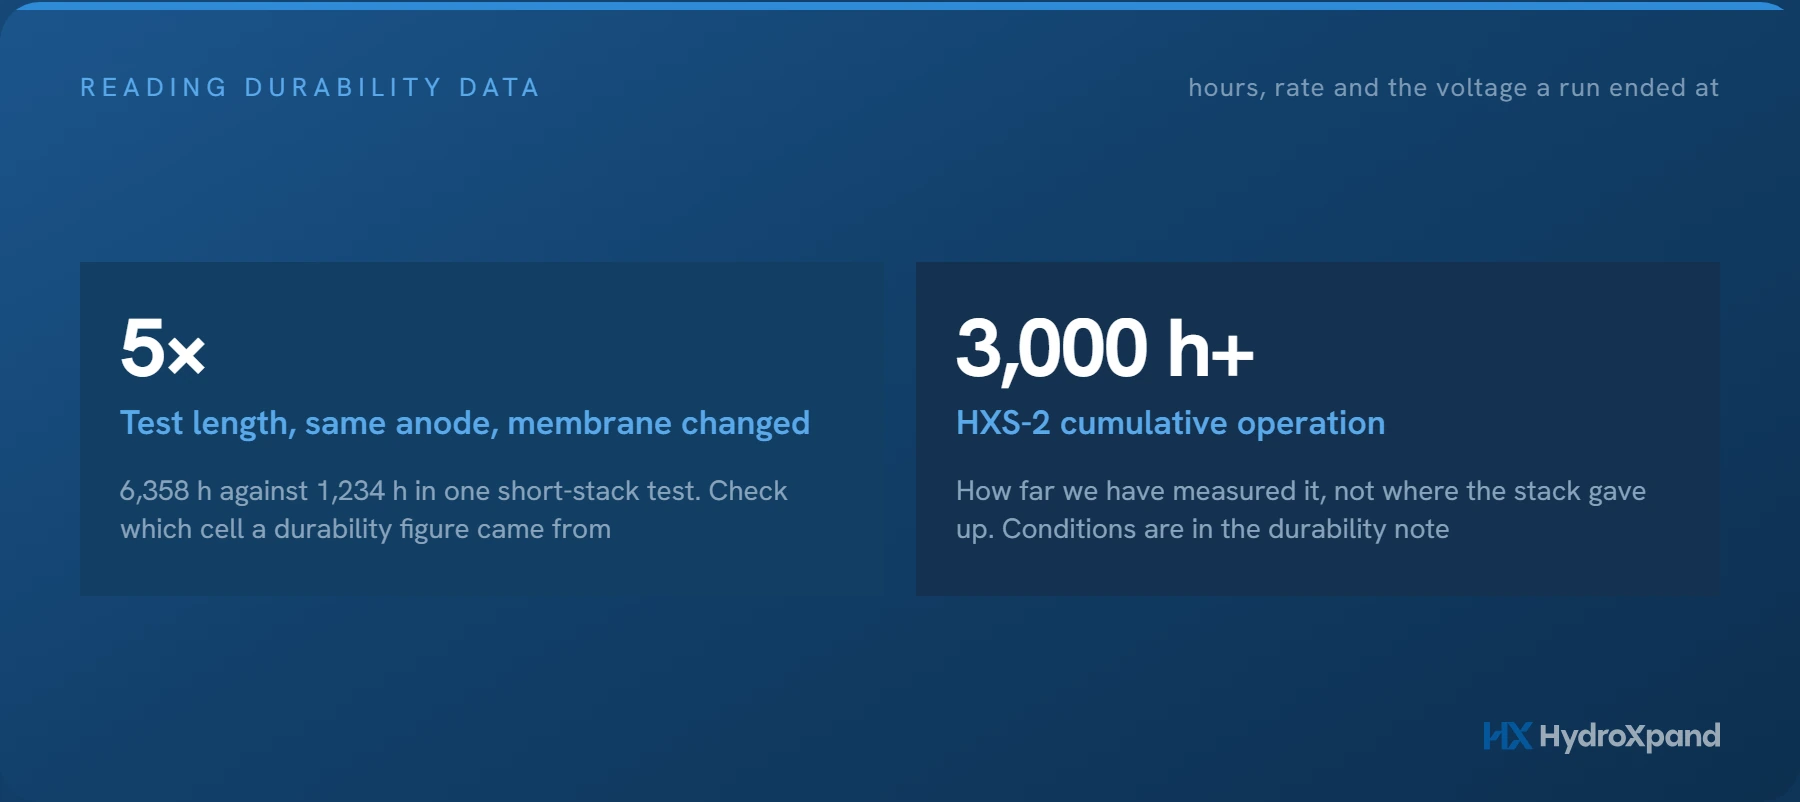
Those 6,358 hours were not obtained by the anode alone: the same anode in the same short-stack test with a different membrane has a record of 1,234 hours, a test length five times shorter.
So a durability figure for one electrode or one membrane cannot be carried over to a cell built differently. If you buy electrodes and build your own cell, first ask what membrane and conditions the supplier's durability figure was obtained with.
- Anode durability note→The short-stack test conditions, and the published AEM durability reports set side by side.
What we publish, and what we do not know yet
Our 2 kW stack, HXS-2, has now run for more than 3,000 hours of cumulative operation at 0.3 M KOH, 40 °C and 50 A. That is how far we have measured it, not where the stack gave up. The run includes shutdowns and restarts, so we give it as cumulative hours. The test conditions and the cell-voltage record are in the durability note.
What we have not established yet:
- We do not convert hours into a lifetime. That needs a test ended on a criterion for how far the cell voltage may rise, and we have not yet ended a test that way.
- There is no dedicated test of frequent start and stop cycling. We have switched stacks on and off often in our own testing without running into problems, but we have no data on degradation per cycle.
- There is no dedicated test of idle periods either. If the equipment will stand shut down for long stretches, plan operation with that in mind.
We list both so that what has been confirmed and what has not can be read separately.
- HXS-2 durability data→The long-run record with every test condition attached.
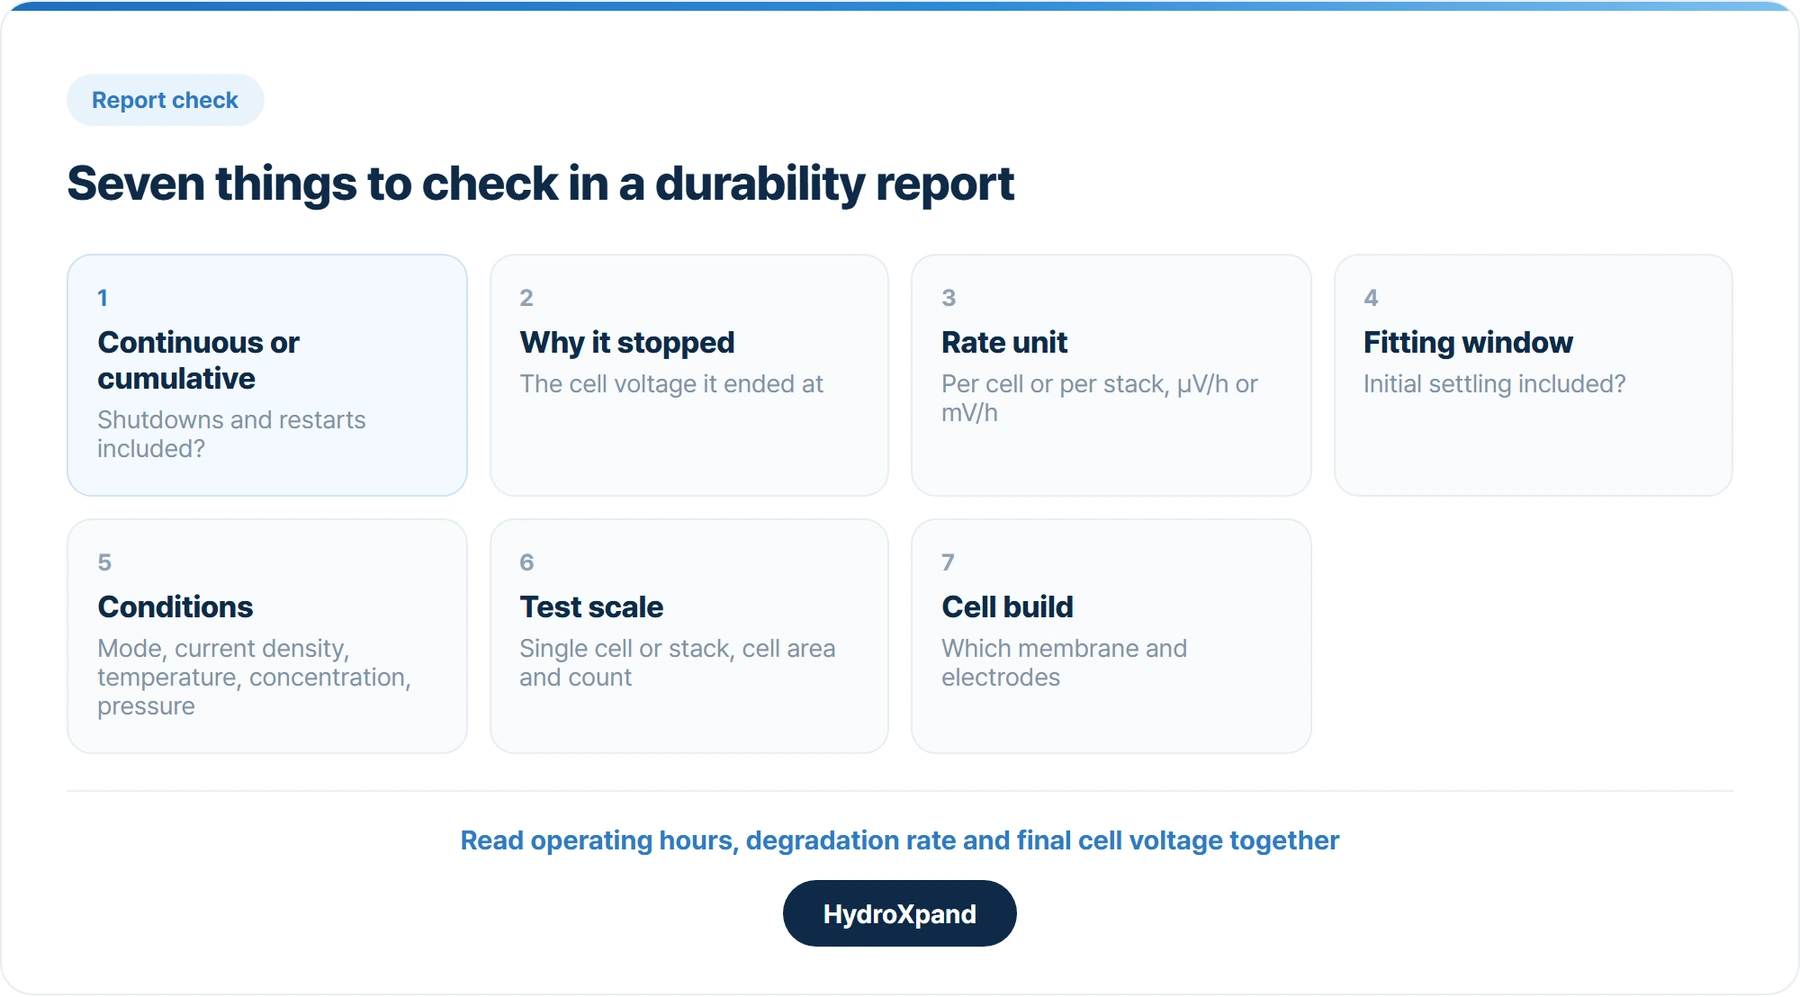
Seven things to check in a durability report
- Continuous or cumulative operation
- Why the test stopped, and the cell voltage it ended at
- Degradation rate per cell or per stack, in µV/h or mV/h
- The fitting window, and whether the initial settling period is included
- Operating mode, current density, temperature, concentration and pressure
- Single cell or stack, cell area and number of cells
- Membrane and electrodes
- Electrolyzer efficiency: what the number means→The same reading applied to an efficiency figure.
- Is AEM proven?→What has been demonstrated, and what still takes time.
- Stack life and MEA replacement→Why a test length is not a replacement interval.
- Cell voltage distribution→Why a stack average hides the weakest cell.
Frequently asked questions
Does more than 3,000 hours mean the stack has to be replaced every 3,000 hours?
3,000 hours is how far we have measured the HXS-2, which is different from a replacement interval. When to replace a stack depends on how far the cell voltage has risen and how much efficiency loss the application can accept.
Does a lower degradation rate mean a stack that can run longer?
Only when the rates were measured under the same conditions and fitted over the same window. A rate fitted over the later part of a run comes out smaller than one fitted over the whole run.
Can a single-cell durability result predict stack life?
It is a reference, not a prediction. In a stack each cell sees different electrolyte distribution and compression, and the weakest cell often sets the operating limit of the stack, so ask for stack-level records as well.
What durability can be expected with frequent start and stop?
We have no dedicated cycling test yet. We have switched stacks on and off often without problems, but we cannot give a figure for degradation per cycle.
Looking at AEM for a specific application?