The published 2,281-hour galvanostatic window for an HXS-2 23-cell stack in 0.3 M KOH at 40 °C has a full-run linear fit of 80.2 µV/h/cell. This note explains why that number cannot be converted into product lifetime and what to review alongside it.
When durability is compared between electrolysis stacks, the first number people see is the test duration. 1,000 hours, 2,000 hours, 10,000 hours: longer looks more trustworthy. Yet test duration alone does not tell you the lifetime of a stack or how it will behave on your site.
Two tests of 2,000 hours can mean very different things depending on the current they ran at, the temperature and electrolyte concentration, how the voltage moved over time, and whether cell-to-cell spread and gas crossover were tracked alongside it.
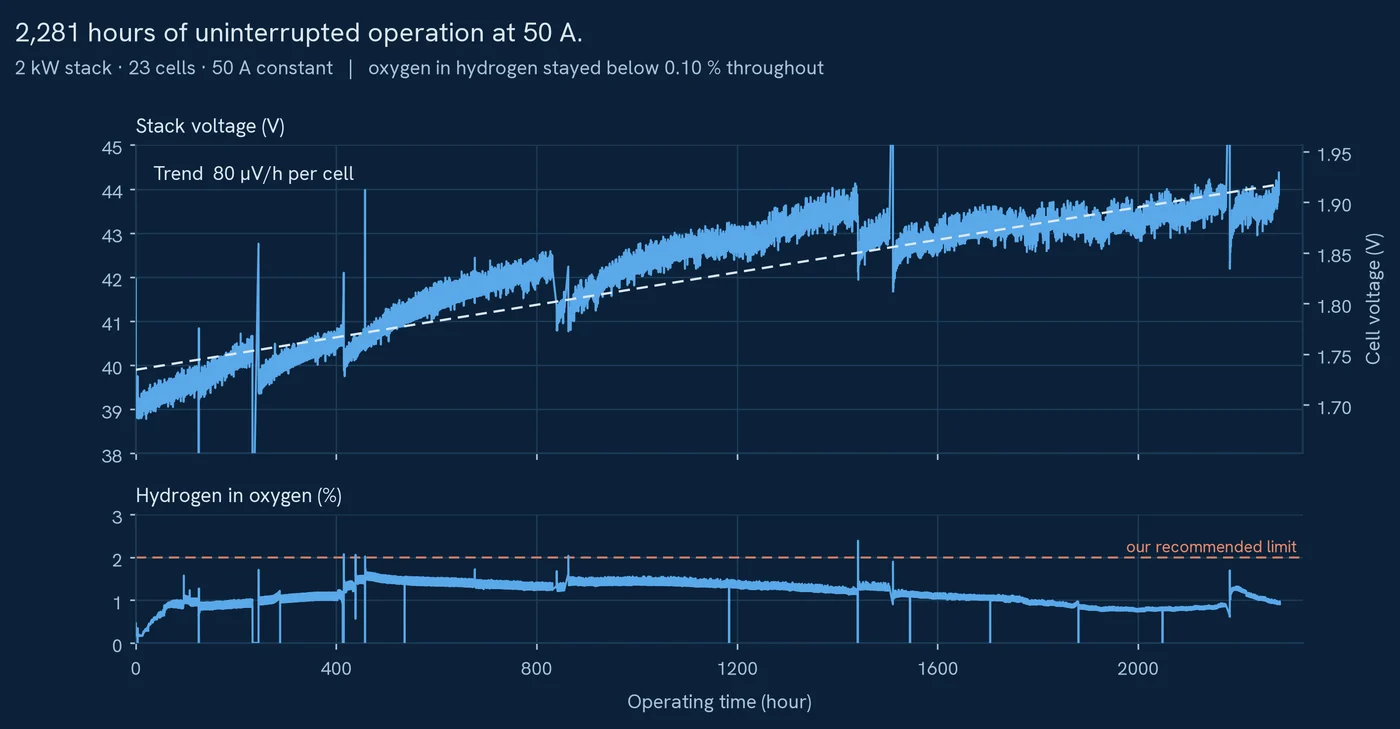
We ran an HXS-2 23-cell AEM electrolysis stack continuously under galvanostatic conditions in 0.3 M KOH at 40 °C. The published 2,281-hour window has a full-run linear fit of 80.2 µV/h/cell, with no sign of accelerating degradation. This note does not convert that number into a product lifetime. Instead it sets out what researchers and system integrators should check when they review long-run data.
Start with the test conditions
A galvanostatic test holds the current constant and watches how the required voltage changes. If more voltage is needed to make the same amount of hydrogen, electrochemical losses have grown. So a durability dataset has to answer two questions, not one: how long did it run, and how fast did the voltage move at the same current.
| Item | Disclosed condition |
|---|---|
| Unit under test | HXS-2 AEM electrolysis stack |
| Cell count | 23 cells |
| Mode | Continuous galvanostatic operation |
| Current | 50 A |
| Electrolyte | 0.3 M KOH |
| Temperature | 40 °C |
| Duration | 2,281 hours |
| Cell voltage span | 1.699 → 1.907 V |
| Observed degradation | Approx. 80 µV/h by linear regression |
What 80 µV/h means
µV/h/cell is the hourly voltage change normalised to a single cell. Because stacks have different cell counts, comparing total stack voltage drift is not a fair comparison. Normalising per cell lets you put stacks of different sizes on the same axis.
The important point is the fitting window. The 80.2 µV/h/cell figure is a linear fit across the published 2,281-hour window. Segment slopes can differ, so the full-run fit should not be extrapolated as though the same degradation rate will continue indefinitely.
A new MEA can shift in voltage during activation and stabilisation. Long-run data has to be read in parts: the initial change, the stable region, and the trend after it. When degradation rates are compared, also ask which time window was fitted and how interruptions and restarts were handled.
2,281 hours is not the same as lifetime
A long test is important evidence, but it is not a warranty period or a replacement interval.
First, this result was obtained at one specific condition, 0.3 M KOH and 40 °C. We cannot assert the same degradation rate at higher temperature, a different electrolyte concentration, repeated start-stop cycling or pressurised operation. Second, galvanostatic operation is one mode; a site coupled to renewable power, where load moves continuously, needs separate dynamic validation. Third, a per-cell voltage trend cannot stand in for gas quality and safety.
So the published 2,281-hour dataset is evidence that a long galvanostatic run was performed at this condition without a sign of accelerating degradation. It is not a number that guarantees lifetime at every condition.
Look at the cell distribution, not just the mean
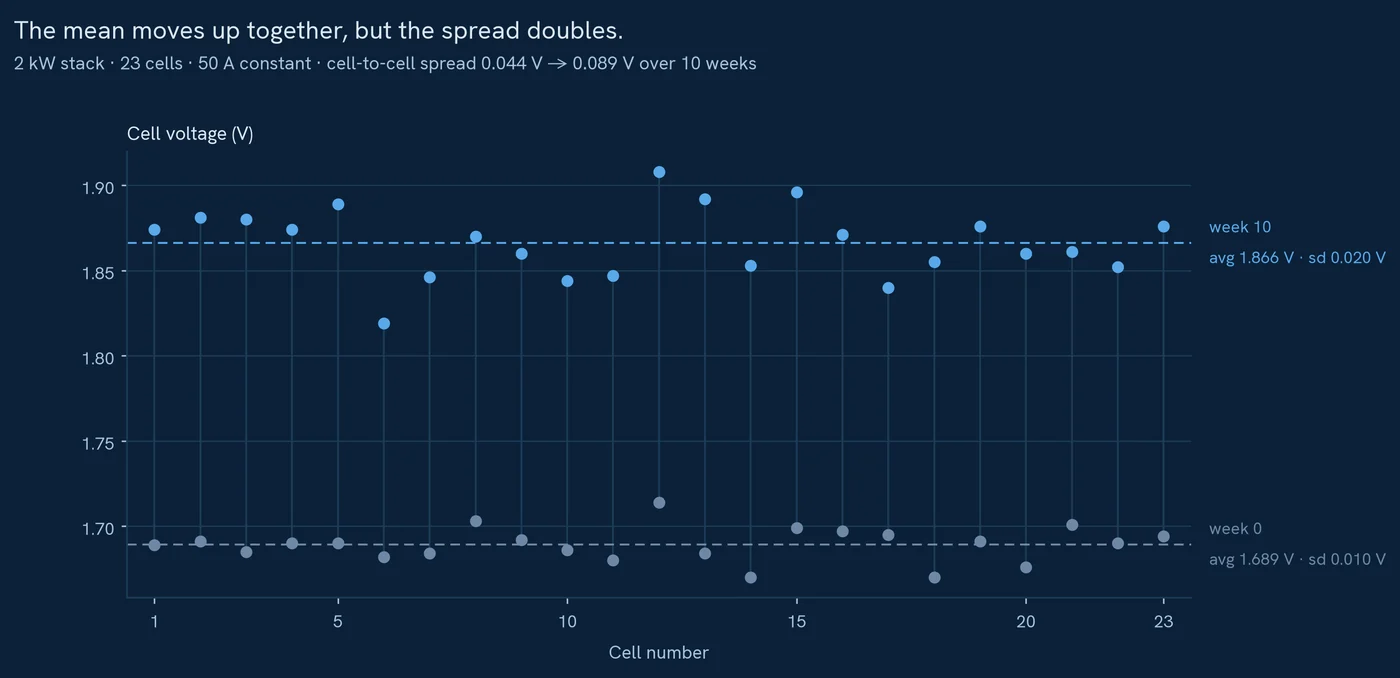
The mean voltage of a 23-cell stack can look stable while one cell moves faster than the rest. That weak cell is what determines stack performance and the service point. When you review stack data, ask for these three together.
- Total stack voltage against time
- Per-cell voltage distribution and standard deviation
- The trend of the highest and lowest cell
Gas crossover is a separate safety axis
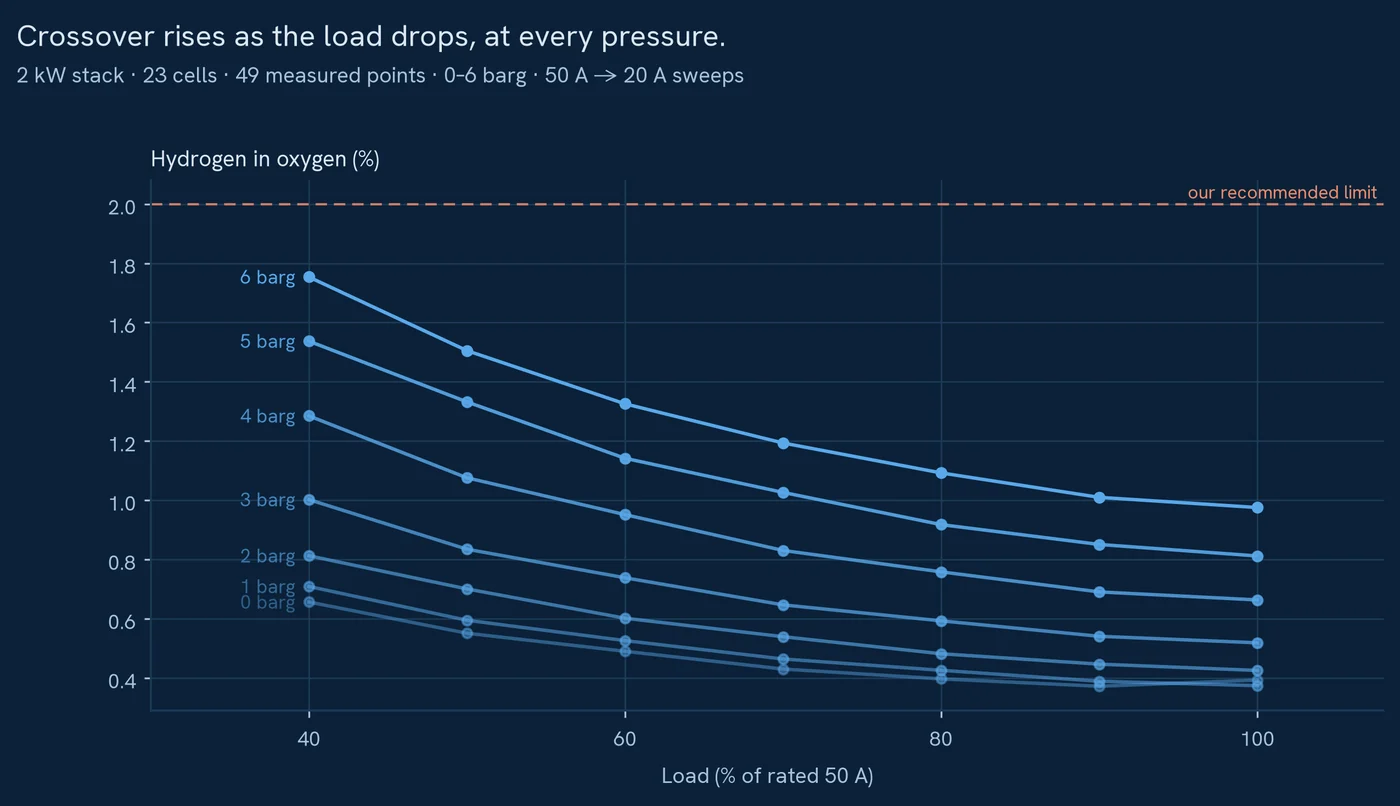
In an AEM stack, hydrogen and oxygen are produced on either side of the membrane. Even with a stable voltage trend, rising crossover can create a safety and quality problem. A long durability test therefore has to report electrical performance and gas indicators together.
The two directions have to be read separately. The safety threshold applies to hydrogen in oxygen (H₂-in-O₂). We manage that below 2% in long-run operation and recommend stopping for inspection above 2%. The other direction, oxygen in hydrogen (O₂-in-H₂), stayed below 0.10% across the same 2,281-hour run. Differential pressure, electrolyte circulation, temperature and membrane condition all affect crossover. If you integrate HXS-2 into your own BoP, differential pressure control between anode and cathode, electrolyte circulation, gas-liquid separation, hydrogen detection and interlocks all have to be designed separately from stack performance.
Where durability data meets the service model
No stack holds its performance forever. What matters is what gets replaced when degradation appears, and which hardware can be reused. HXS-2 is a compression-assembled stack, and we refurbish it by taking it back and replacing only the consumable MEA so the hardware is reused.
Long-run data is therefore not a way to postpone replacement. It is the basis for deciding which trend triggers an inspection and which part gets replaced. As a system integrator, it is worth confirming the following before you buy.
- The window and method used to derive the degradation rate
- The acceptance criterion for cell-to-cell spread
- Alarm and shutdown thresholds for H₂-in-O₂
- Disassembly and reassembly instructions for the stack
- Which hardware items are inspected during MEA replacement
- The performance check performed after refurbishment
- Where the warranty ends and consumables begin
How a laboratory can use this data
A laboratory can use the HXS-2 dataset as a baseline for its own catalyst, membrane, MEA or operating conditions. Do not compare voltages measured at different cell sizes and on different test rigs directly. To compare, match current density, active area, temperature, electrolyte concentration, pressure, membrane thickness and the activation procedure.
A good single-cell i-V curve does not carry over unchanged: a 23-cell stack adds cell distribution, fluid distribution, compression and thermal management. If your work is moving from single cell to stack, this order is more useful than chasing one best performance point.
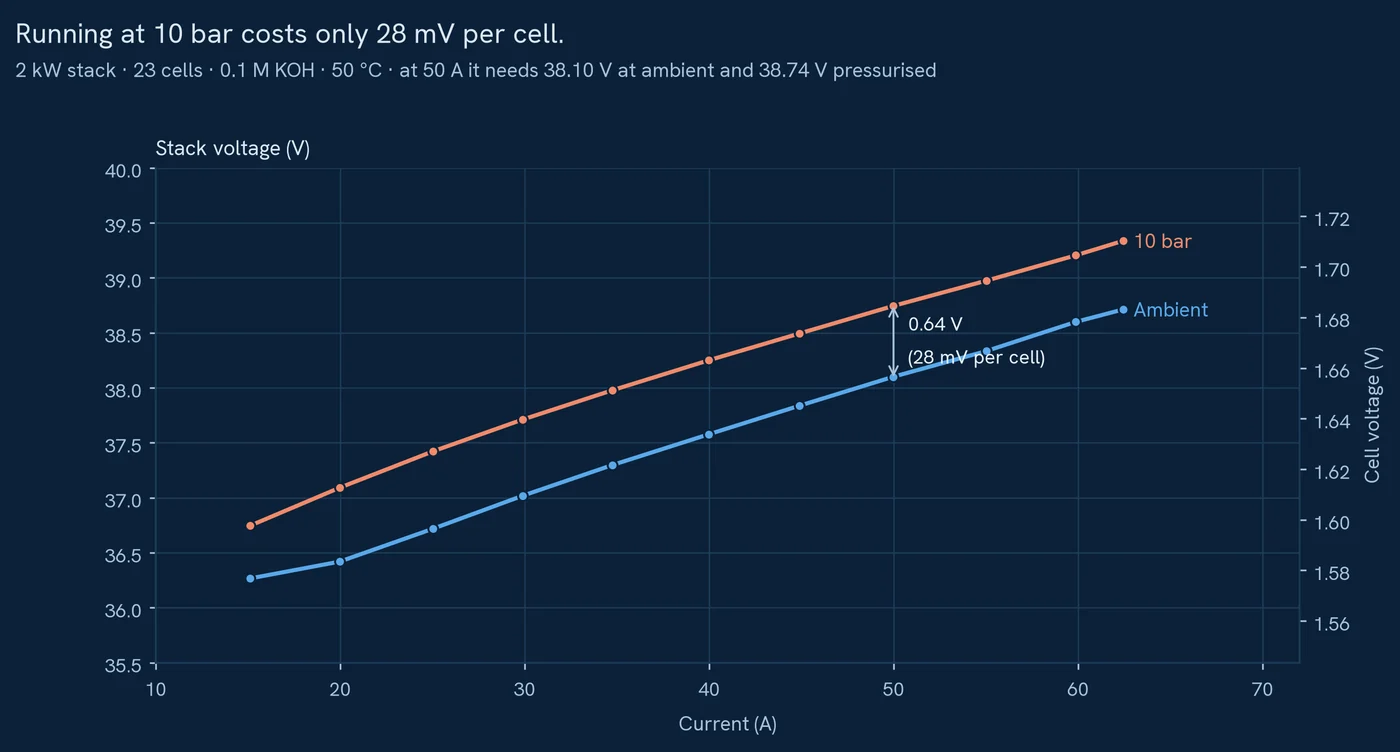
- Obtain i-V curves at matched conditions
- Check the spread across repeated specimens
- Compare performance before and after AST
- Check cell-to-cell uniformity on a short stack
- Confirm the trend with a long galvanostatic run
A checklist for receiving raw data
| What to ask for | Why |
|---|---|
| Raw current and voltage against time | To derive the degradation rate and spot interruptions |
| Temperature and electrolyte concentration logs | To confirm the test conditions were held |
| The fitting window for the degradation rate | To separate out the initial stabilisation region |
| Per-cell voltage distribution | To find weak cells and non-uniformity |
| H₂-in-O₂ trend | To check gas safety and membrane condition |
| Start, stop and restart records | To see the gap between continuous testing and site operation |
| Post-test inspection results | To test the hypothesis behind the voltage change |
In short
The published 2,281-hour HXS-2 window and its full-run linear fit of 80.2 µV/h/cell are a long-run trend obtained at one disclosed condition. They are evidence that we ran an AEM stack for a long time and tracked its voltage. On their own they do not guarantee lifetime or performance at every operating condition.
Good durability data is not one long test duration. It is test conditions, the voltage trend, cell distribution, gas crossover and the service model, connected. If you need the detailed durability graphs and i-V test conditions, send us your project conditions and we will share them.
Need the detailed durability graphs and i-V test conditions?