There is no best electrolysis technology, only the one whose limits your project can live with. This is the set of questions that decides the answer, and what each of the three technologies is actually chosen for.
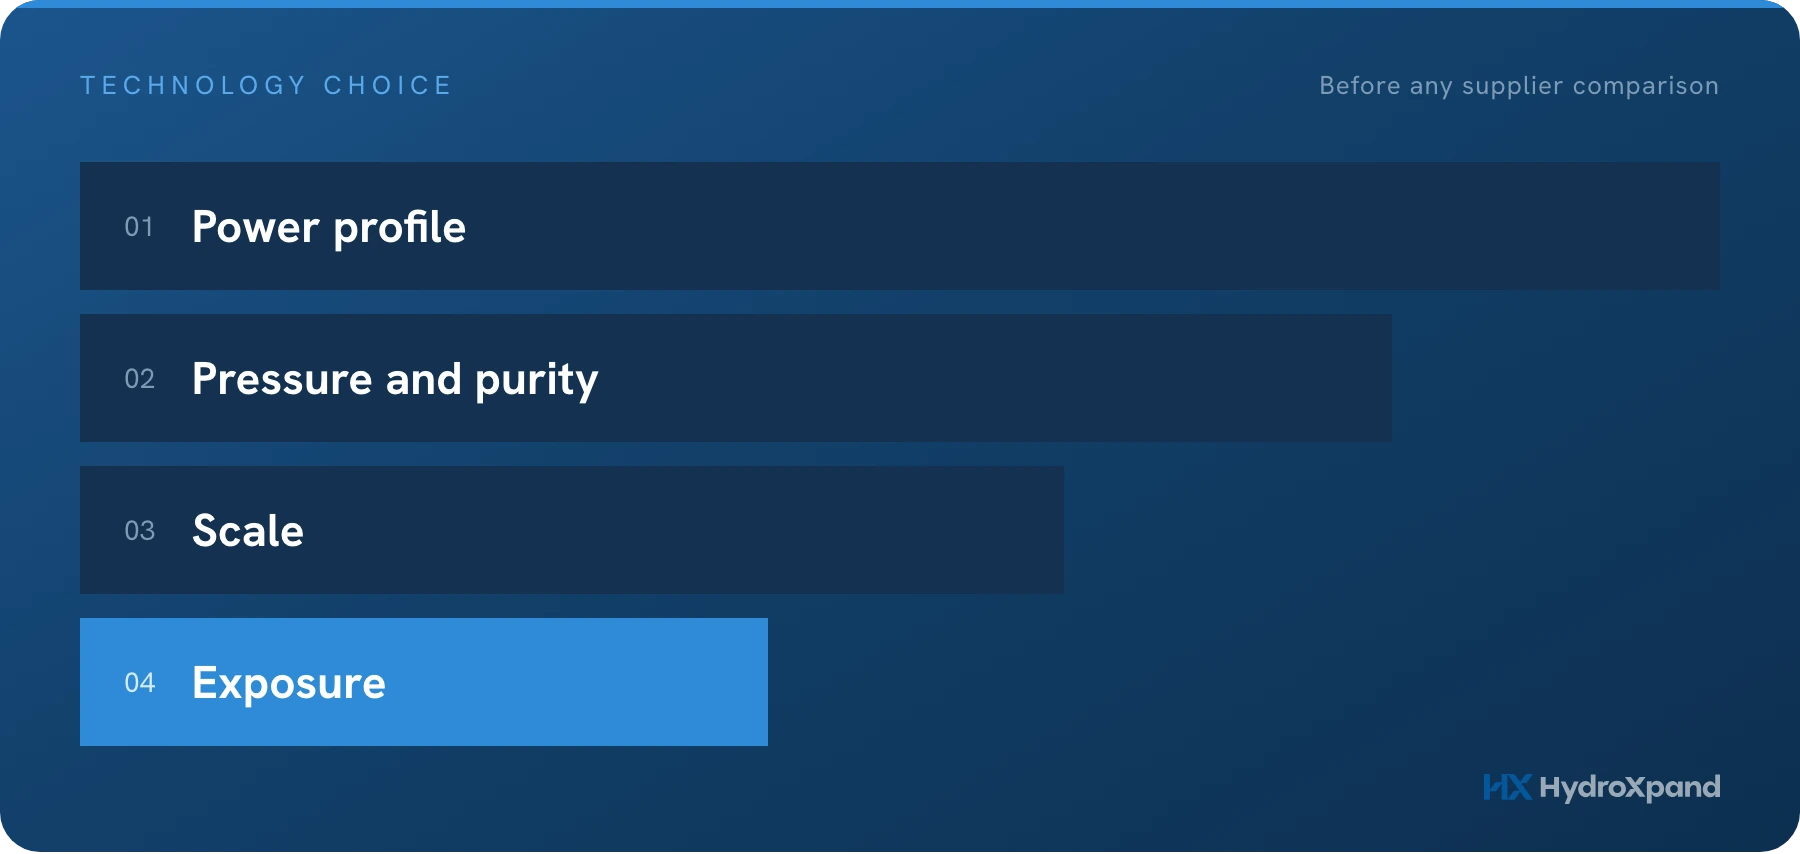
Most technology comparisons in electrolysis end with a winner. That is the wrong shape for the decision, because the three commercial technologies are not competing on one axis. Each is limited by something different, and the right choice is the one whose limit does not bind your project.
This is how we would work through it, including the cases where the answer is not our own technology.
Four questions that come before any supplier comparison
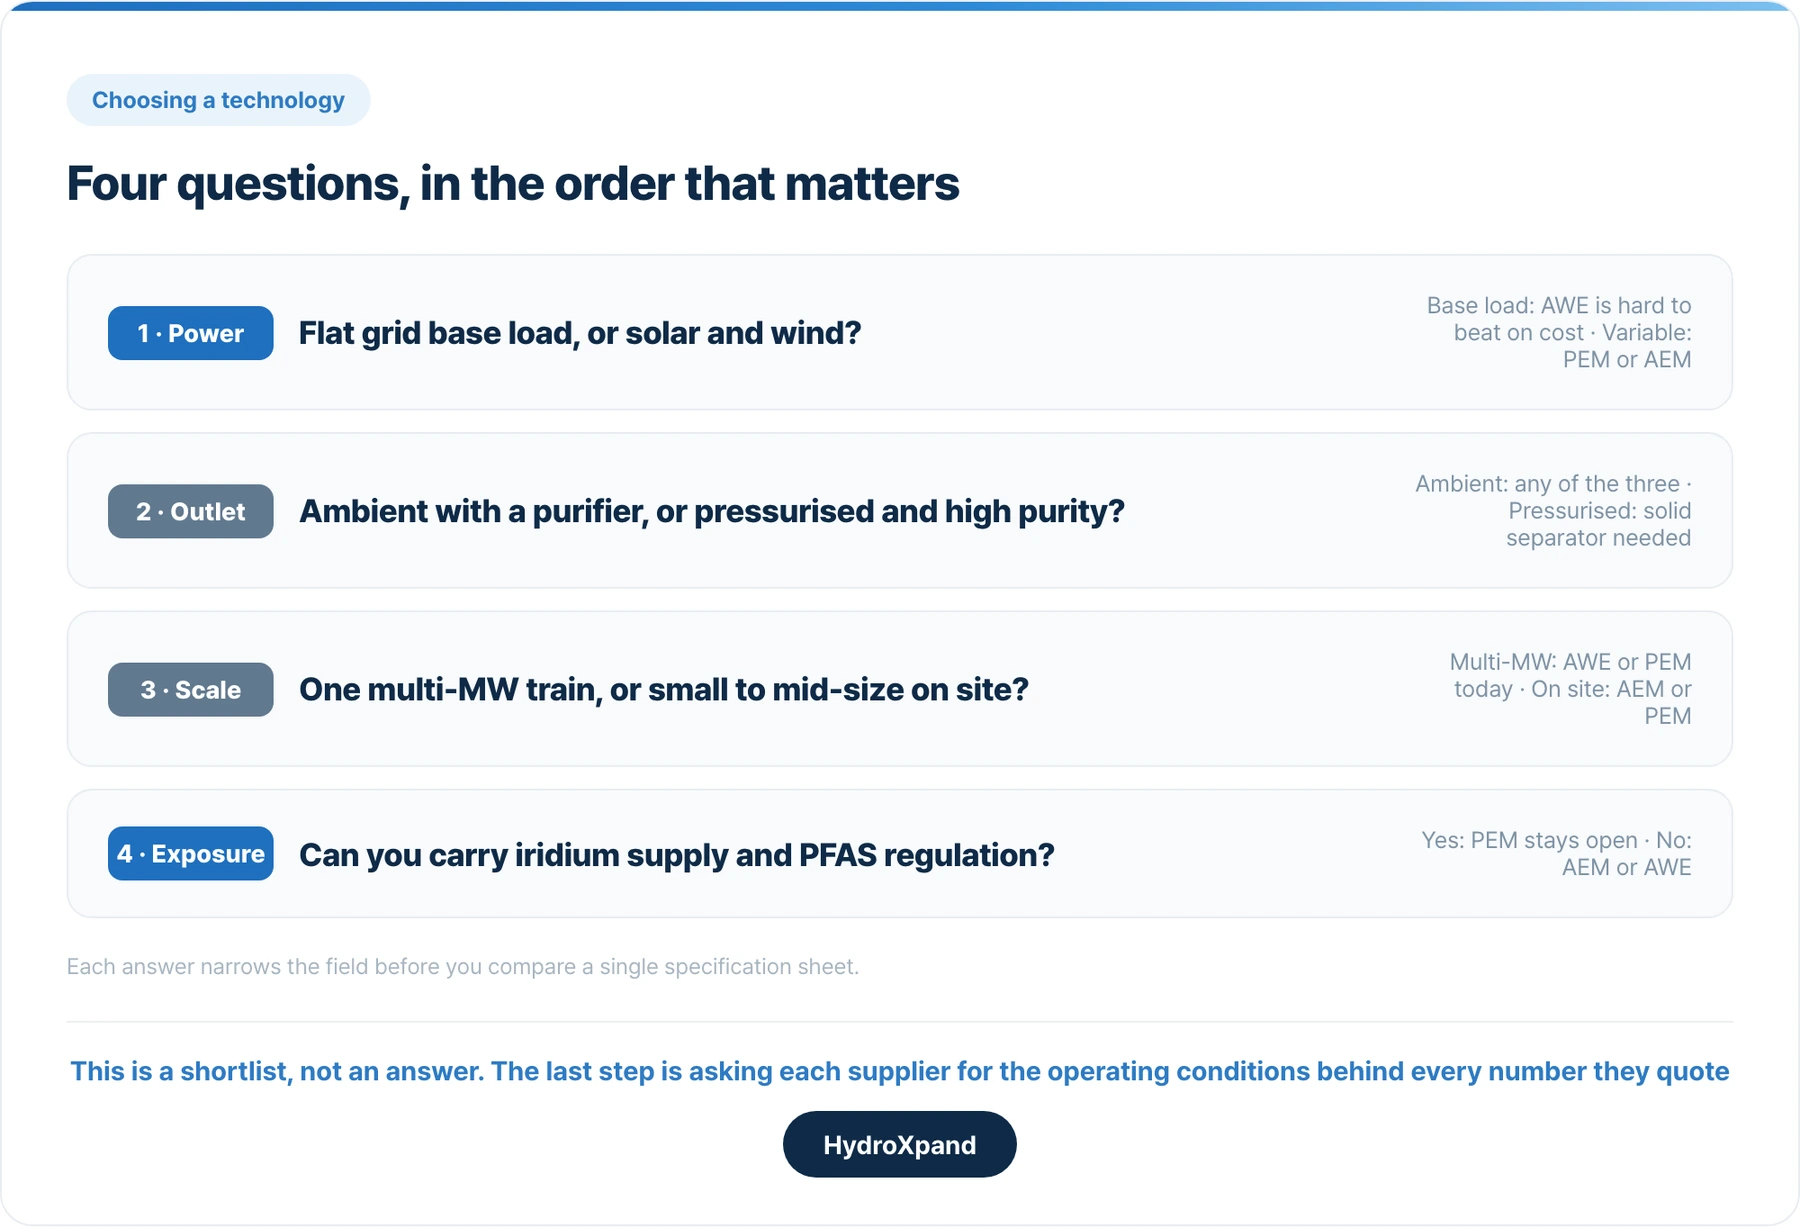
The first question is about the power profile, and it matters more than nameplate efficiency. A flat grid connection running at base load and a solar array with a daily profile are different engineering problems. What decides the outcome is ramp rate and how far the system can be turned down before it has to be shut down rather than reduced.
The second is about the outlet. Hydrogen leaves an electrolyzer at whatever pressure and purity the stack can deliver, and anything beyond that is a compressor and a purifier. That is capital and parasitic load you either avoid inside the stack or add outside it.
The third, scale, usually decides more than the technology choice does. One multi-megawatt train and twenty small units delivering the same output have different economics, different lead times, and different consequences when one of them fails.
The fourth is exposure. Iridium supply and the PFAS restriction proposal are risks outside your project's control. On a ten to twenty year horizon, an open regulatory question about a core material is a line item rather than a footnote.
SourcesInternational Platinum Group Metals Association, White Paper on Iridium (2022) · Hydrogen Europe, Position Paper on PFAS (2023) (industry association)
What each technology is actually chosen for
| AWE | PEM | AEM | |
|---|---|---|---|
| Chosen for | Large, steady loadlowest capex per kW | Variable inputpressure and purity | Variable inputwithout iridium |
| Typical scale | Multi-MW | Small to multi-MW | Small to mid, on site |
| Track record | Industrial use since the 1800s | Mature, widely deployed | Commercial from the 2020s |
| Open risk | Turndown floorcrossover at low load | Iridium supplyPFAS scope | Membrane durabilitysupplier maturity |
This allows the intermixing of the produced gases (hydrogen and oxygen – H2 and O2) that are dissolved in the electrolyte, limiting lower power-operating range
We build AEM, so treat the last column as an interested party's summary and check it. The useful test is not whether a supplier praises their own technology, but whether they will state its limits in writing.
SourcesIRENA, Green Hydrogen Cost Reduction (2020): stack costs and operating ranges by technology · U.S. DOE Technical Targets for Liquid Alkaline Electrolysis and PEM Electrolysis: 2022 capital cost status
- HXS-2 · 2 kW stack→What an AEM stack costs to run at 480 NL/h.
- HXB-V1 · 2 kW system→System form, if you are comparing complete units.
- Datasheets→Six products. No form.
What actually sets the cost of the hydrogen
Capital cost is easy to compare and is usually the smaller half of the answer. It covers the stack and its catalyst, the balance of plant, which is the rectifier, gas separation, drying and water treatment, and then footprint, installation and permitting. Downstream compression and purification belong in this column too, and they are the items most often left out of a comparison because they sit outside the quoted scope.
The running cost is where the hydrogen price is actually set: the electricity price multiplied by the hours you run, divided by the system efficiency at the load you actually operate at, plus the stack replacement interval and maintenance.
If your plant spends most of its hours at 30% load because that is what the solar profile gives you, the efficiency and the crossover behaviour at 30% load are what set your cost and your safety case.
Where we would answer honestly that it is not us
- A flat, cheap, large industrial load with no interest in pressure or footprint. Alkaline is likely to be the lowest total cost, and no argument about generations changes that.
- A multi-megawatt single train delivered next year with a fifteen-year operating record behind the specific model. AEM suppliers cannot offer that today, ourselves included.
AEM is the right answer when the project needs dynamic operation, pressurised and pure hydrogen at small or mid scale, and a supply chain that avoids iridium and needs little platinum-group metal (our HXP-an anode is PGM-free; the HXP-ca cathode carries 0.2 mg of PGM per cm²), and when the buyer is willing to look at measured data rather than accept a category claim.
What to ask, whichever technology you choose
| Ask for | Why |
|---|---|
| Efficiency, with its basis | HHV and LHV differ by about 18% on the same hardware |
| Where it was measured | Cell, stack and system numbers are not comparable |
| Current density and temperature | Efficiency rises as a cell is run softer |
| Durability, with the load it was run at | Hours alone do not describe a test |
| Crossover across the pressure range | This is a safety limit, not only an efficiency one |
| Cell-to-cell spread | Tells you about the process, not the best cell |
These six apply to every supplier in every technology, and the answers are more informative than the comparison table at the front of any brochure.
For our own products we publish them. The HXS-2 stack has more than 3,000 hours of cumulative operation, and its long-run data is published with the test conditions in our durability note. Measured at 50 A in 0.1 M KOH at 50 °C and ambient pressure, the same stack reaches 90.0% efficiency on a higher heating value basis at beginning of life, and runs up to 10 barg on the hydrogen side without a separate compressor.
The HXS-2 is available to order and ships four weeks from PO acceptance; the HXP-an anode and HXP-ca cathode ship in two weeks.
- AEM electrolysis: technology and measured data→How AEM electrolysis works, AEM vs PEM vs alkaline, and the measured data behind our stacks.
- How to read an efficiency figure→The first item on that list, in full: HHV against LHV, and cell against stack against system.
- What changes when the membrane is anionic→Why AEM exists, what it has not solved, and our measured crossover across load and pressure.
- HXS-2 durability data→The long-run data and test conditions behind the durability answer above.
- What water electrolysis is→The fixed numbers every one of these technologies is measured against.
- Solid oxide electrolysis→The fourth technology, and the one condition that decides whether it is available to you.
- Is AEM proven?→The shorter record, our published run with its conditions, and what it does not cover.
- When AEM is not the answer→Three kinds of project we would point elsewhere.
Frequently asked questions
Which electrolysis technology is best: alkaline, PEM or AEM?
There is no best technology, only the one whose limits your project can live with. Alkaline is chosen for large steady plants, PEM for fast response and pressure, and AEM for alkaline chemistry inside a membrane cell without iridium.
What should I decide before comparing electrolyzer suppliers?
Four questions come first: the load profile you will actually run, the pressure and purity you need at the outlet, the site utilities available, and the operating history you require. The technology follows from those answers.
Does part-load operation change which technology fits?
Yes. If a plant spends most of its hours at 30% load because of a solar profile, the efficiency and gas crossover at 30% load set the cost and the safety case, not the rated point.
Sources
- Green Hydrogen Cost Reduction — International Renewable Energy Agency, 2020
- Technical Targets for Liquid Alkaline Electrolysis — U.S. Department of Energy
- Technical Targets for Proton Exchange Membrane Electrolysis — U.S. Department of Energy
- White Paper on Iridium — International Platinum Group Metals Association, 2022
- Position Paper on PFAS — Hydrogen Europe, 2023
Looking at AEM for a specific application?