Pressurising the stack to skip a compressor costs you cell voltage: 28 mV per cell at 50 A. But what actually bounds the operating range is gas crossover, not voltage, and crossover gets worse as the load drops. Set out here with two stacks running at 10 barg, at 922 and 954 hours.
Storing hydrogen or putting it into a line needs pressure. There are two ways to get it: take hydrogen out of the stack at ambient and compress it, or pressurise the stack itself and receive it already at pressure.
Choose the second and you remove a compression stage, the power it draws, the low-pressure buffer between stack and compressor, and one more rotating machine to maintain. In exchange, three things change inside the stack.
1. The voltage cost is small
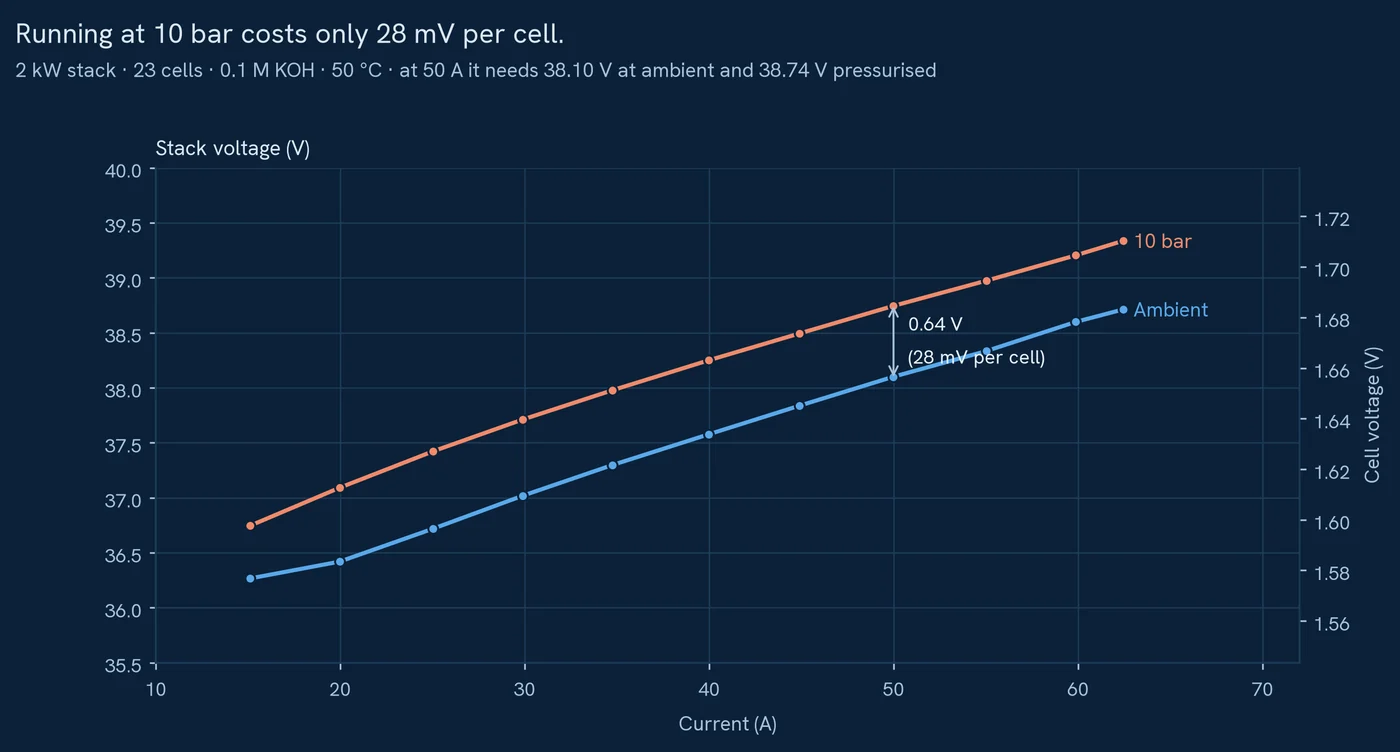
Pressurised operation needs a higher voltage to pass the same current, because the Nernst term rises. This is not a loss that can be engineered away; it is what thermodynamics asks for.
We measure it at 28 mV per cell at 50 A. Across a 23-cell stack that is 0.64 V, about 1.7% of the cell voltage at the same condition.
That 1.7% is the debit on the pressurised side of the ledger. The credit side holds the compressor's power draw, the low-pressure buffer and its safety equipment, and the maintenance of a rotating machine. Which side is larger depends on the pressure you need and on your utilisation, so it has to be worked out per project. What the figures above settle is the size of the cost inside the stack.
2. Crossover, not voltage, sets the operating range
A small voltage penalty does not make pressurised operation easy. The real limit sits on a different axis.
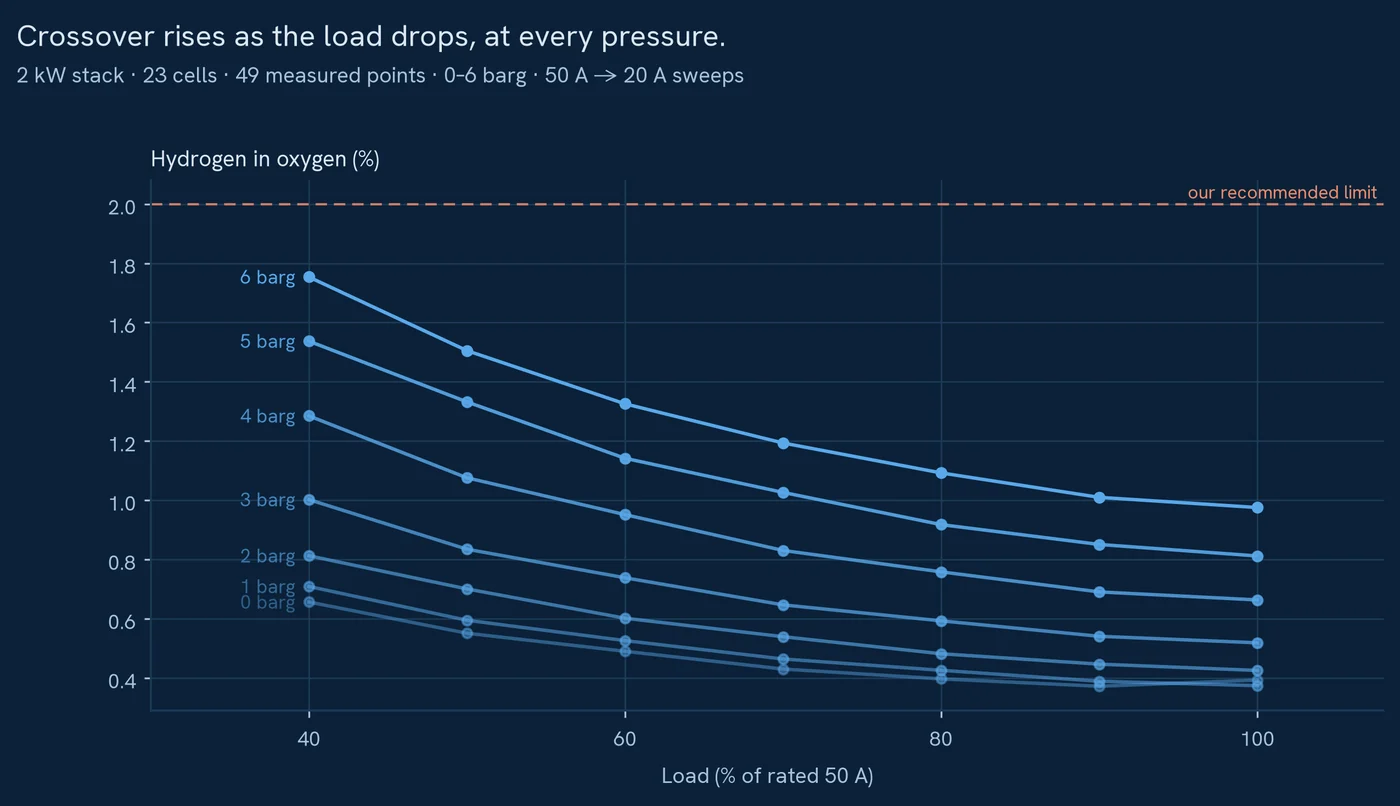
The hydrogen partial pressure difference across the membrane is what drives permeation, so raising pressure sends more hydrogen to the oxygen side. Drop the load on top of that and the oxygen being produced falls while the hydrogen crossing over does not fall as fast, so the concentration climbs again. The two effects multiply.
The figure above is those 49 measured points. Four corners show what multiplying means here.
Raise pressure alone to 6 barg at rated load and the figure goes up 2.5 times. Drop load alone to 40% at 6 barg and it goes up another 1.8 times. The corner where both meet is 4.5 times the ambient rated figure, and it leaves 0.25 percentage points of headroom against our 2% control limit.
What matters is that this is a safety limit rather than an efficiency limit. Losing efficiency is tolerable; crossing this line is not. So in pressurised operation the minimum load becomes a function of pressure.
If you are planning to couple to renewables, look at this figure first. A solar profile spends many of its hours at low load, and low load is exactly where crossover is highest.
| Hydrogen in oxygen | Rated load (50 A) | 40% load (20 A) |
|---|---|---|
| Ambient (0 barg) | 0.39% | 0.66% |
| 6 barg | 0.98% | 1.75%0.25 points below the 2% limit |
- HXB-V1 · 2 kW system→0 or 10 barg selected in software.
- Datasheets→Six products. No form.
3. Long-term behaviour is not something we can state yet
Pressurised testing runs in 0.1 M KOH, while the 2,281-hour HXS-2 ambient run used 0.3 M KOH. Read the electrolyte concentration alongside the two datasets when you place them side by side.
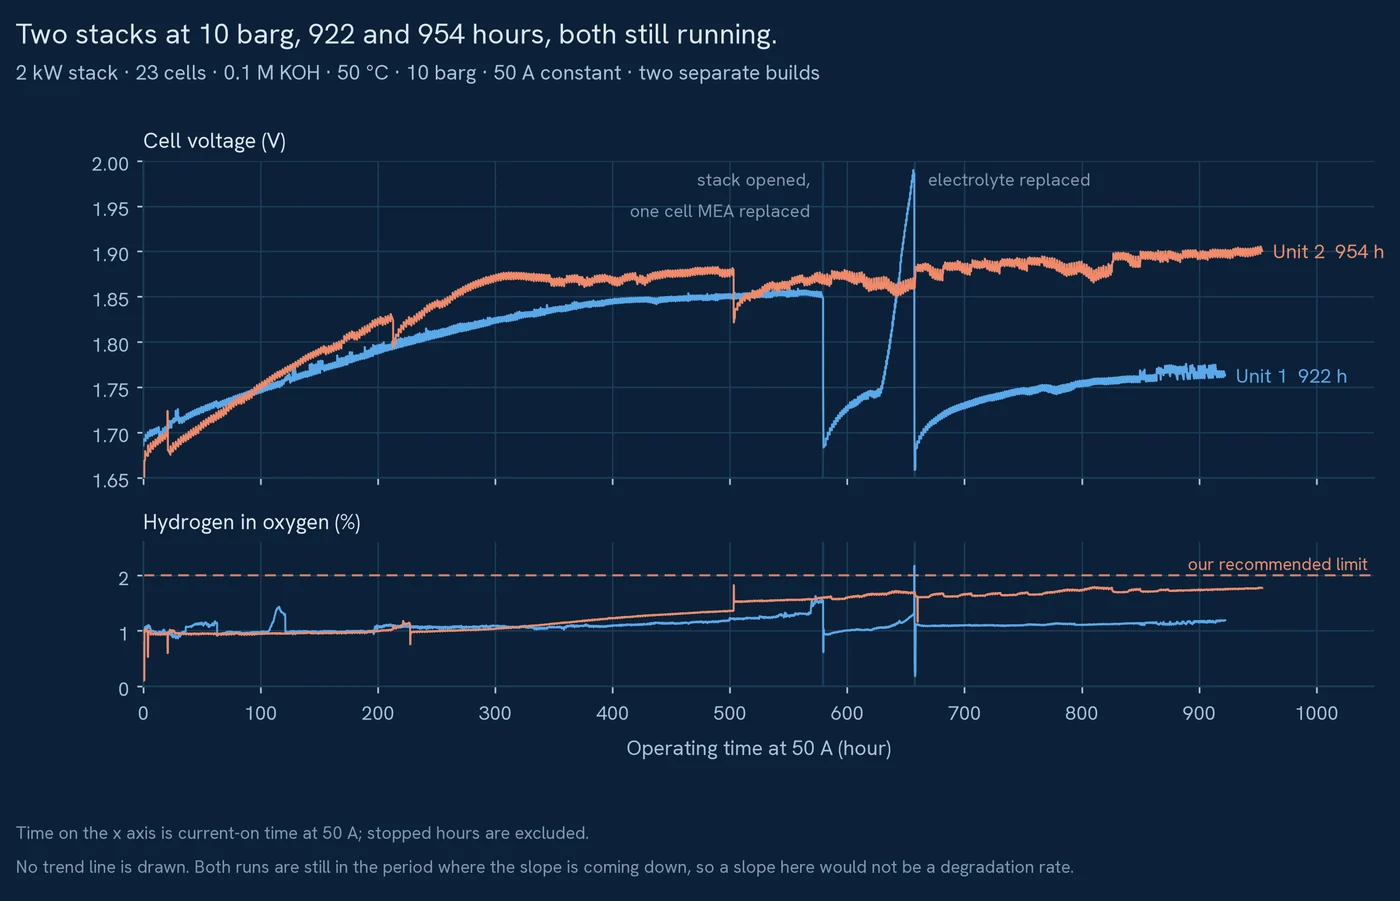
We are running two stacks galvanostatically at 10 barg. As of 12 September 2026 they stand at 922 and 954 hours of current-on time, and both are still running. Cell voltage went from 1.691 to 1.764 V on Unit 1 and from 1.669 to 1.903 V on Unit 2. Hydrogen in oxygen has stayed below our recommended 2% limit on both.
The x axis is not calendar time. It is the time 50 A was actually flowing, with stopped hours removed. Degradation is divided by time, so counting hours when nothing was running makes degradation look slower than it is.
The two stacks are separate builds, and they track each other closely out to about 300 hours. That is the only way to tell whether a result belongs to the technology or to one particular stack.
The vertical lines mark points where we intervened. On Unit 1 the stack was opened and the MEA in one cell was replaced, and the electrolyte was replaced later. So the Unit 1 curve is not one uninterrupted history of a single stack.
We have not converted the voltage rise into a degradation rate. It is the early period in which electrodes and membrane settle into the operating condition, and the slope is still coming down. On our ambient run that slope took 1,200 hours to flatten.
So what we hold today is two curves, not a pressurised degradation rate. We will publish one in the same format as the ambient data once the test reaches a settled window.
The 10 barg on our catalogue and datasheets is a pressure rating. The long-term degradation rate at that condition is not a figure we have published. Please read the two separately.
What to check when evaluating
- Fix the outlet pressure you actually need first. Asking for 10 barg where 6 barg would do spends crossover headroom for nothing.
- Fix your expected minimum load. Where that load and pressure land on the crossover curve is the starting point of the safety case.
- Count everything that leaves with the compressor. Not just the electrical load, but intermediate storage, its safety equipment and its maintenance.
- Ask for total run hours behind any pressurised data. A slope over a short window is not a degradation rate.
- Ask for crossover by pressure and by load. A single figure at rated output tells you nothing about the operating range.
In short
The design variable in pressurised operation is not voltage. It is minimum load.
The voltage cost is a settled figure at 28 mV per cell, and it is small. What actually bounds the operating range is crossover, and it is tightest in the corner where pressure and low load meet. The long-term degradation rate needs both runs to reach a settled window before we will state it.
Raw data is available on request, including voltage and current logs, gas concentration logs and the operating conditions.
- The anode that looks best on day one is not the one that lasts→Note 3. How the anode is made, and what that does to durability.
- Reading stack durability data→The ambient long-run dataset, and what to check alongside a degradation rate.
- Alkaline, PEM or AEM: how to choose→Where pressure and purity sit among the questions that decide a technology choice.
- Do you need a compressor?→This dataset read as a purchasing question: what pressurised output covers.
- Running an electrolyzer on solar→The same 49 points read the other way: how far the load can drop.
Need the detailed durability graphs and i-V test conditions?