Most stack performance data gives one voltage and a run time. That voltage is the sum of every cell in the stack, and the cell that moves first is invisible in it. Here is why the spread matters and what to ask a supplier for.
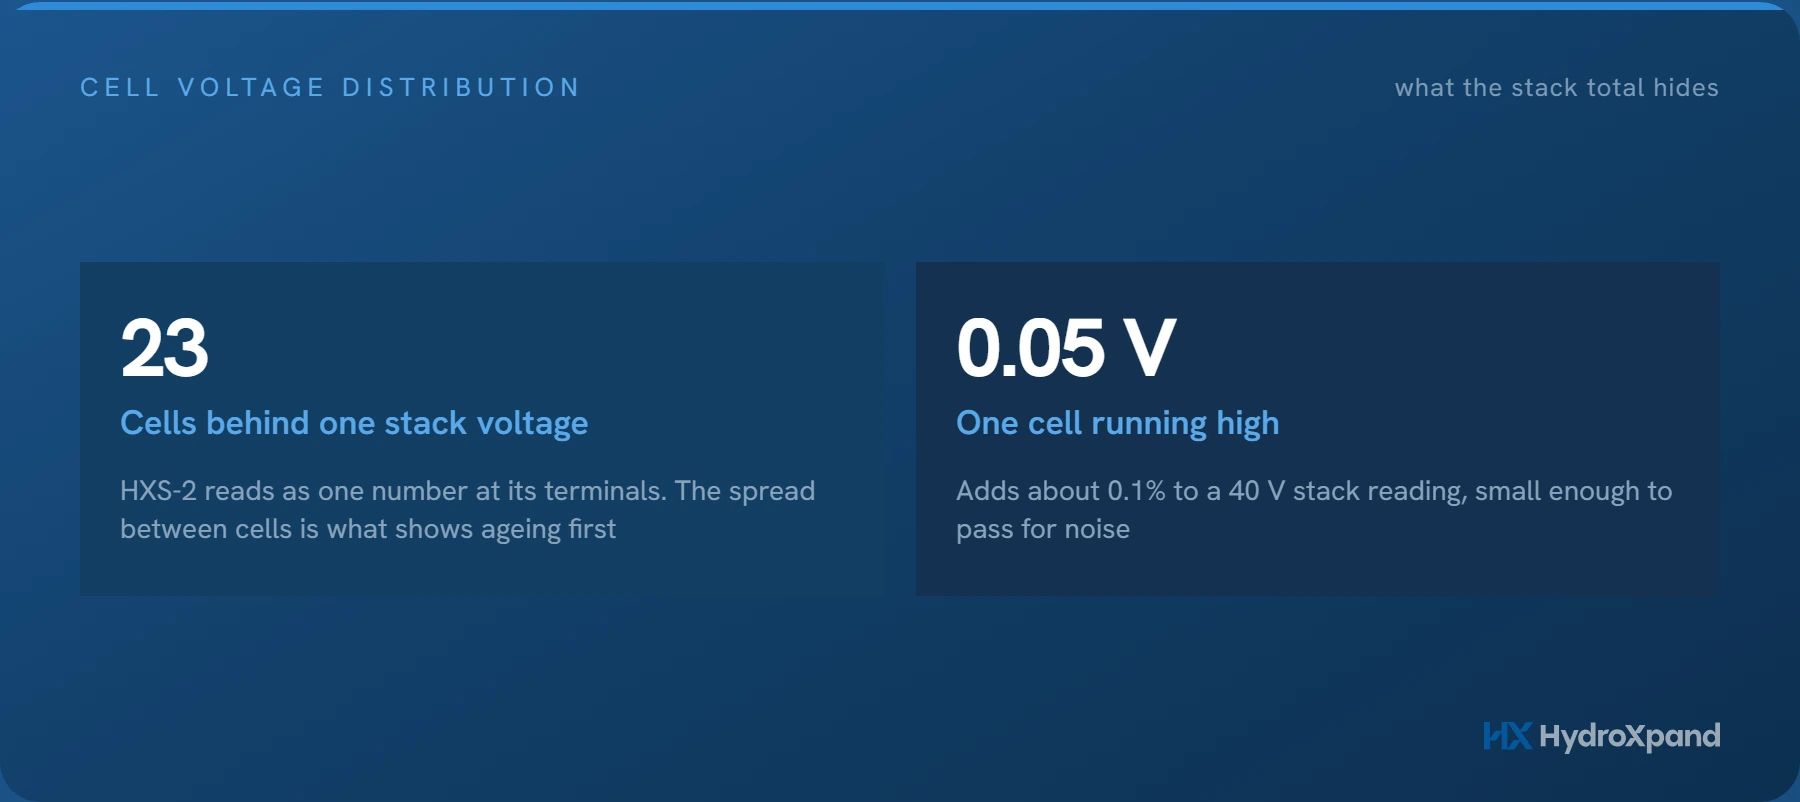
Stack performance data usually arrives as two things: a voltage and a number of operating hours. The stack, though, is cells stacked in series, and the voltage on the meter is all of them added together. On a 23-cell stack, one reading carries the condition of 23 cells.
That is why our long-run data includes the cell-by-cell distribution alongside the voltage trend. This piece explains why the spread deserves its own look, for anyone buying a stack to build into their own system or reviewing a supplier's data.
A stack voltage is 23 readings added together
A cell is the smallest unit that splits water: an anode, a cathode and the membrane between them. One cell makes only a small amount of hydrogen, so practical products stack many of them and connect them in series. The same current passes through every cell in turn, and the stack voltage is the sum of the cell voltages.
That has an awkward consequence. A cell sitting 0.05 V above the others adds about 0.1% to a stack voltage of about 40 V, which is easy to read as noise.
Current does not spread the load the way you might hope. In series, a cell in worse condition cannot take less current than its neighbours. It carries the same current and needs more voltage to do it, so it works harder electrochemically. A cell under more strain tends to change faster, and as it changes its voltage rises again. Without per-cell readings, the stack voltage just looks like a slow, gentle rise while this is going on.
Same total, different stack
Two stacks can show the same voltage and be in quite different condition inside.
In one, all 23 cells sit close together. The current is shared evenly, and when performance does drop the whole stack drifts together. In the other, twenty cells run a little low and three run noticeably high. The sum is the same. The three high cells are carrying more of the burden, they will degrade first, and when they do, the whole stack comes out for service.
A catalogue figure cannot tell these two apart. Only a per-cell reading can, which is why it is worth checking whether a spread is reported next to any average or total.
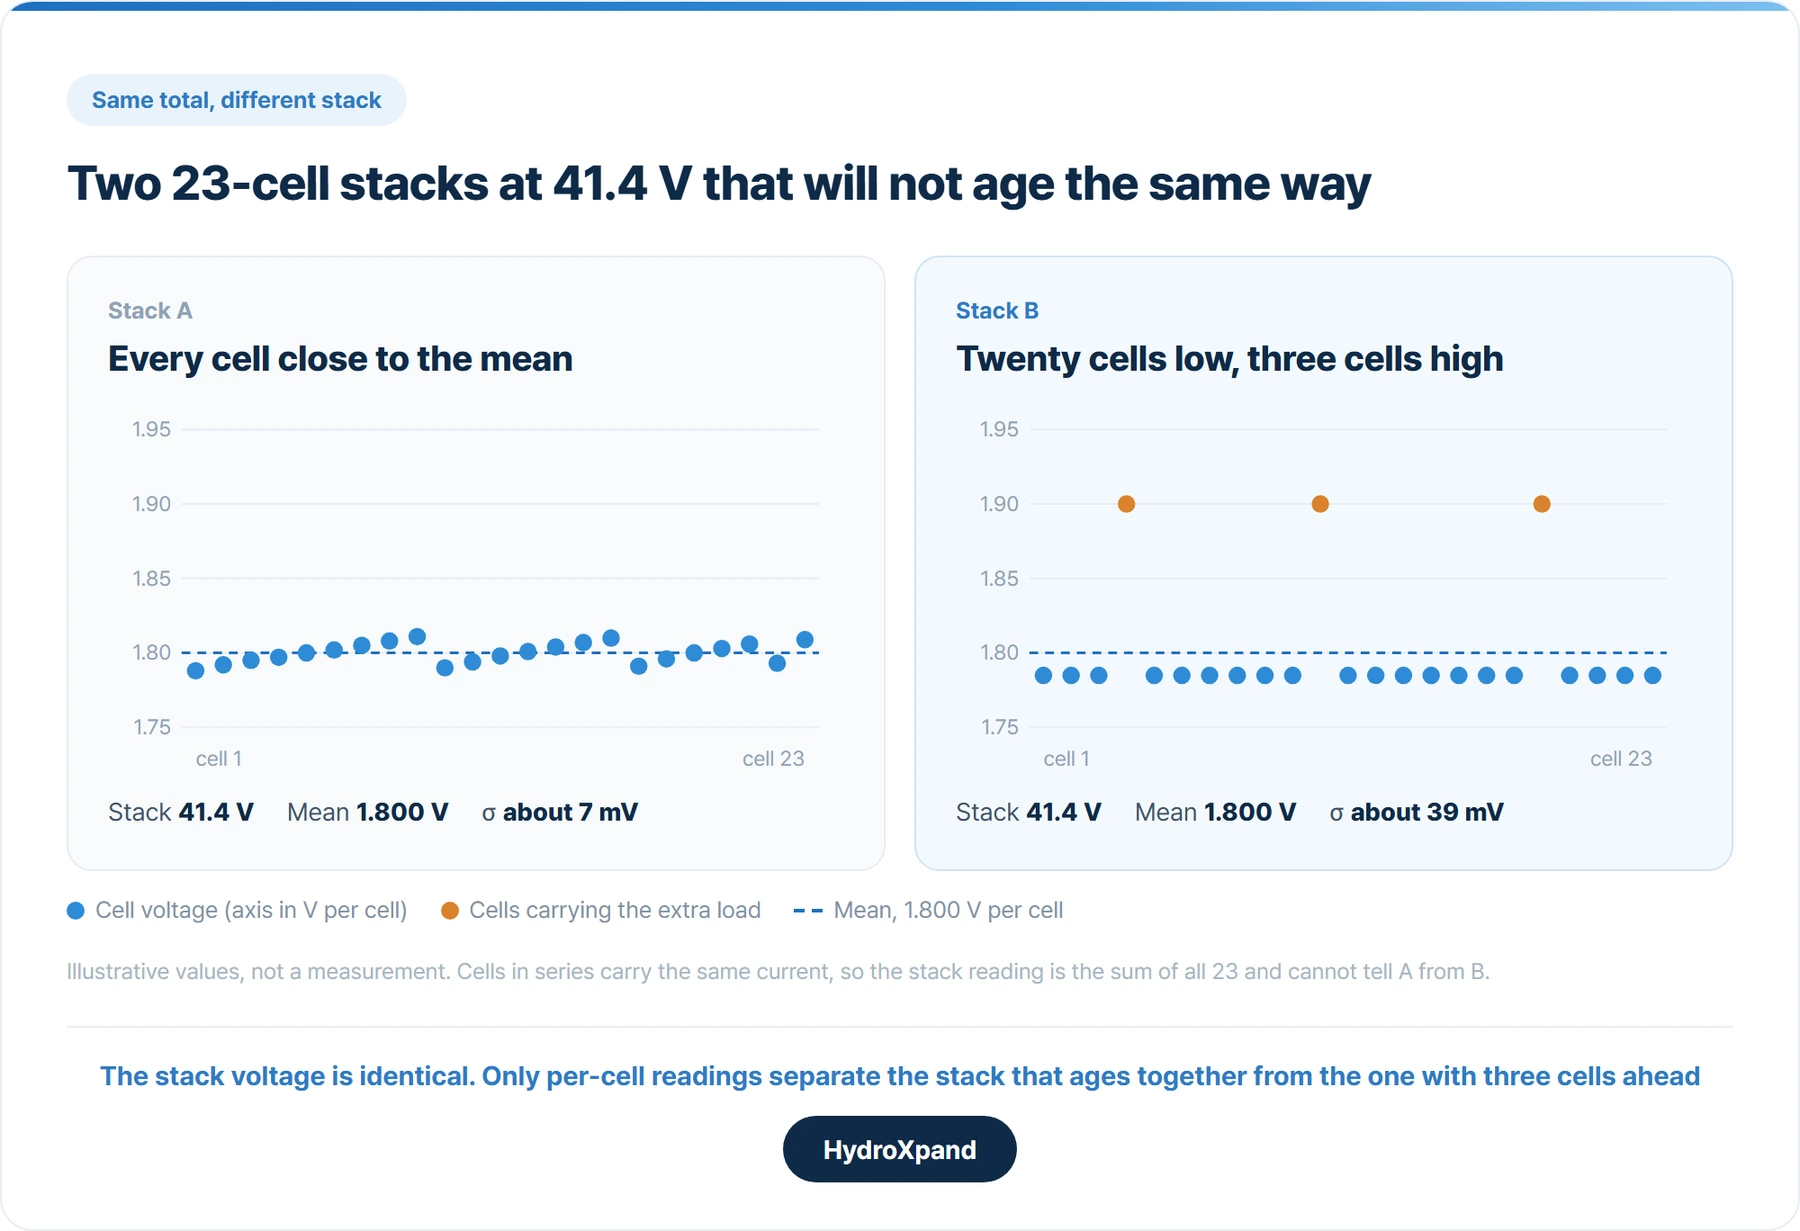
Two stacks can read the same voltage while one has three cells well ahead of the rest.
What our own HXS-2 data includes
Our long-run data carries this item. The HXS-2 is a 23-cell stack with more than 3,000 hours of cumulative operation, and its long-run data is reported with the voltage trend, the gas indicators and the per-cell distribution.
In that data the spread between cells widened while the mean voltage rose. Had we published only the mean trend, that change would not be visible at all.
A wider spread is not a failure on its own. What it does tell you is which cells to check first if operation continues under the same conditions. A stack whose mean rises with a steady spread and a stack whose spread opens at a steady mean call for different handling afterwards. The measured values, test conditions and graphs are in the durability note.
Why the weakest cell sets the service point
The replacement interval of a stack is not set by its average. One cell running ahead of the rest shows up in three ways. Energy use rises first, because a higher cell voltage means more electricity for the same hydrogen; it is small per stack and adds up over a long run. The stop criterion arrives early, because with an upper limit on cell voltage the highest cell reaches it while the mean still has margin, and the whole stack stops. And tracing the cause gets harder, because without a per-cell record there is nothing left to show where the loss started.
Spread tends to come from three places, whichever electrolysis technology is involved. Each calls for a different fix, and the position of the cell that drifted is often the first clue.
| Source of spread | What happens | What a per-cell record lets you see |
|---|---|---|
| Electrolyte distribution | Flow design or bubble behaviour gives some cells less electrolyteless ion supply and poorer heat removal | Whether the high cells share a position in the flow path |
| Compression | Uneven clamping gives uneven contact resistancelow-pressure spots read high | Whether the high cells cluster in one region of the stack |
| Temperature | Middle and end cells lose heat differentlya cooler cell needs more voltage at the same current | Whether the end cells drift apart from the middle |
With per-cell data, the position of a drifting cell narrows the cause before the stack is opened. Without it, the cause stays a guess until the stack is taken apart. The design side of all three is covered in our stack explainer.
From one cell to a stack
Materials are usually screened in a single small cell, where i-V curves compare catalysts and membranes. A good result there does not guarantee the same result in a stack, because spread, distribution, compression and thermal management do not exist in a single cell. So a sensible order is matched-condition i-V curves, then the spread across repeated specimens, then uniformity on a short stack, and then a long galvanostatic run for the trend. We validate in the same order: single cell, then a short stack for uniformity, then a full stack run for the long-run trend.
Three things to request with stack data
- Total stack voltage against time. The voltage trend and the hours have to be read together to judge the rate of degradation.
- Per-cell voltage distribution and standard deviation. Comparing the start and the end of the run shows how the spread moved.
- The trend of the highest and the lowest cell. A mean and a standard deviation alone cannot separate one cell far out from many cells drifting a little.
Cell spread is best read as a trend: whether it keeps opening under the same conditions, and whether one cell is leaving the rest.
Those three apply to any supplier and any technology. If you want cell-level data from your own installation, confirm before ordering how individual cell voltages will be read in your setup, because a stack-voltage-only arrangement cannot give them back later.
What the record is for depends on what can be replaced. On HXS-2 the consumable is the MEA, where the electrodes and membrane meet and where most of the performance change happens. The bipolar plates and end plates are hardware that gets reused. HXS-2 is compression-assembled, so the stack can be opened and only the MEAs replaced, and we offer that as a service when the stack is sent back to us. The spread record is not a way to postpone that work. It is how you decide which trend triggers an inspection and what gets replaced.
- HXS-2 durability data→The measured cell-to-cell spread, with conditions and the per-cell graph.
- What is an electrolyzer stack→Compression, flow and repeated interfaces: the design side of cell-to-cell spread.
- Why your AEM test does not match the datasheet→Matching conditions before comparing a single cell or stack result.
- Choosing an AEM test cell→The single-cell stage that comes before a short stack.
- Is AEM electrolysis proven?→What a published run covers, and what it does not.
- HXS-2 maintenance→Reading the voltage trend, and when a widening spread calls for action.
- HXS-2 · 2 kW stack→23 cells, compression-assembled, MEA replacement and hardware reuse.
Frequently asked questions
Why is the stack voltage not enough to judge an electrolyzer stack?
Because the cells are in series and the stack voltage is their sum, so one cell 0.05 V high adds only about 0.1% to a 40 V stack. Two stacks with the same voltage can have very different spreads inside.
Where can I see measured cell-to-cell spread for HXS-2?
In the HXS-2 durability note, which reports the per-cell voltage distribution alongside the voltage trend and the test conditions.
What should I ask for when reviewing stack data?
Total stack voltage against time, the per-cell voltage distribution with its standard deviation, and the trend of the highest and lowest cell.
Sources
- EU harmonised accelerated stress testing protocols for low-temperature water electrolyser, EUR 31748 EN — European Commission Joint Research Centre, 2024
Looking at AEM for a specific application?