Our 2 kW stack is 23 cells of 79 cm²; the 30 kW stack is 46 cells of 512 cm². Making the cells bigger exposed contact resistance first. Adding cells exposed the spread between them. Measured at each step from one cell to 46, with what to look for in large-stack results.
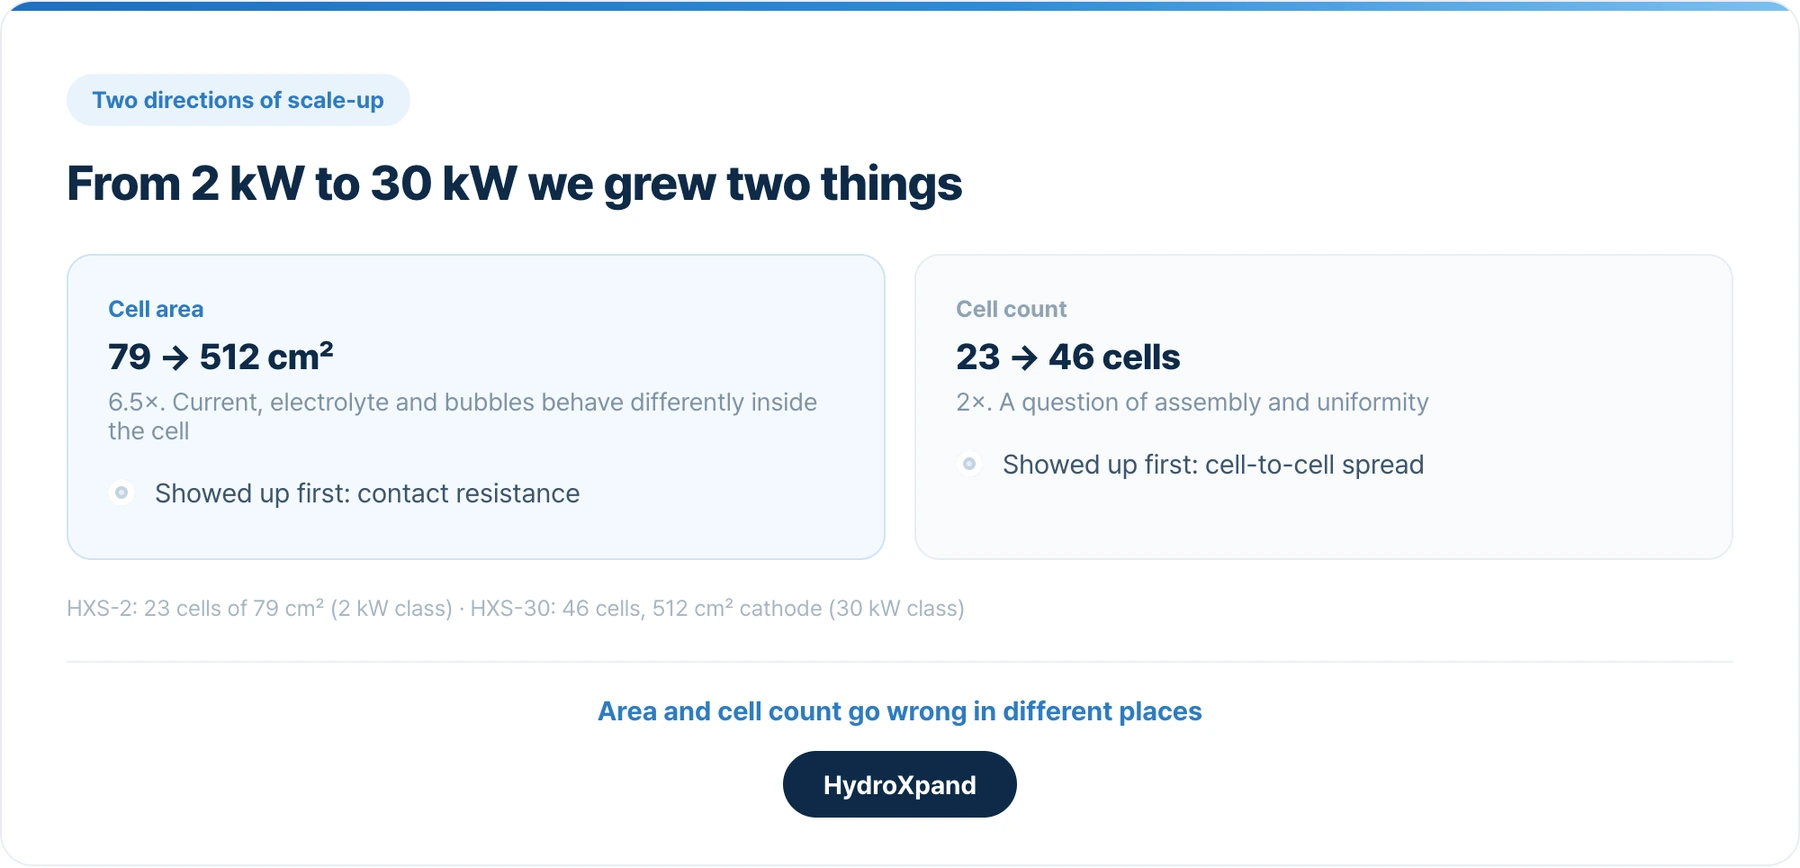
The stack we sell today, the 2 kW HXS-2, is 23 cells of 79 cm². The next one, the 30 kW HXS-30, is 46 cells of 512 cm². Getting roughly fifteen times the output meant making each cell 6.5 times larger and doubling the number of cells. We measured at every step on the way: one cell, five, fifteen, then forty-six.
Each step brought out a different problem. Larger cells exposed resistance. More cells exposed the spread between them. If you are reviewing test results for a large stack, those two things deserve as much attention as the average cell voltage.
- Look at cell area and cell count separately. They go wrong in different places.
- If a large-area cell underperforms, find the cause before trying to fix it. In our case it was contact resistance, not the catalyst.
- Ask for individual cell voltages on any stack with many cells. The average hides the spread.
- Do not read the voltage rise of the first tens of hours as a degradation rate. Early settling and real decline are mixed together.
Two ways to make a stack bigger
Stack output comes from cell area, current density and the number of cells. If current density stays about the same, you either make the cells larger or stack more of them.
| HXS-2 (2 kW class) | HXS-30 (30 kW class) | Ratio | |
|---|---|---|---|
| Active area per cell | 79 cm² | 512 cm² (cathode) | 6.5× |
| Number of cells | 23 | 46 | 2× |
| Current used for comparison | 50 A | about 360 A | about 7× |
Adding cells is a question of assembly and uniformity, so you can see in advance where the difficulty will be. Making cells larger changes what happens inside them: whether current spreads evenly across the wider face, whether electrolyte reaches the corners, whether bubbles get out. You only find out by testing. We enlarged the area first, and it took longer than adding cells.
Larger cells exposed contact resistance first
The first 512 cm² single cell ran at 1.925 V at 0.64 A/cm². The HXS-2 runs at 1.645 V per cell at a similar 0.633 A/cm², so the new cell was almost 280 mV higher.
If catalyst activity is the cause, the electrode has to be remade. If resistance is the cause, the cell hardware has to change. We looked at the shape of the voltage curve and at impedance together to tell the two apart.
| Large-area single cell | HXS-2 | |
|---|---|---|
| Ohmic resistance | 0.4 Ω·cm² | 0.23 Ω·cm² |
| Difference × 0.64 A/cm² | about 109 mV |
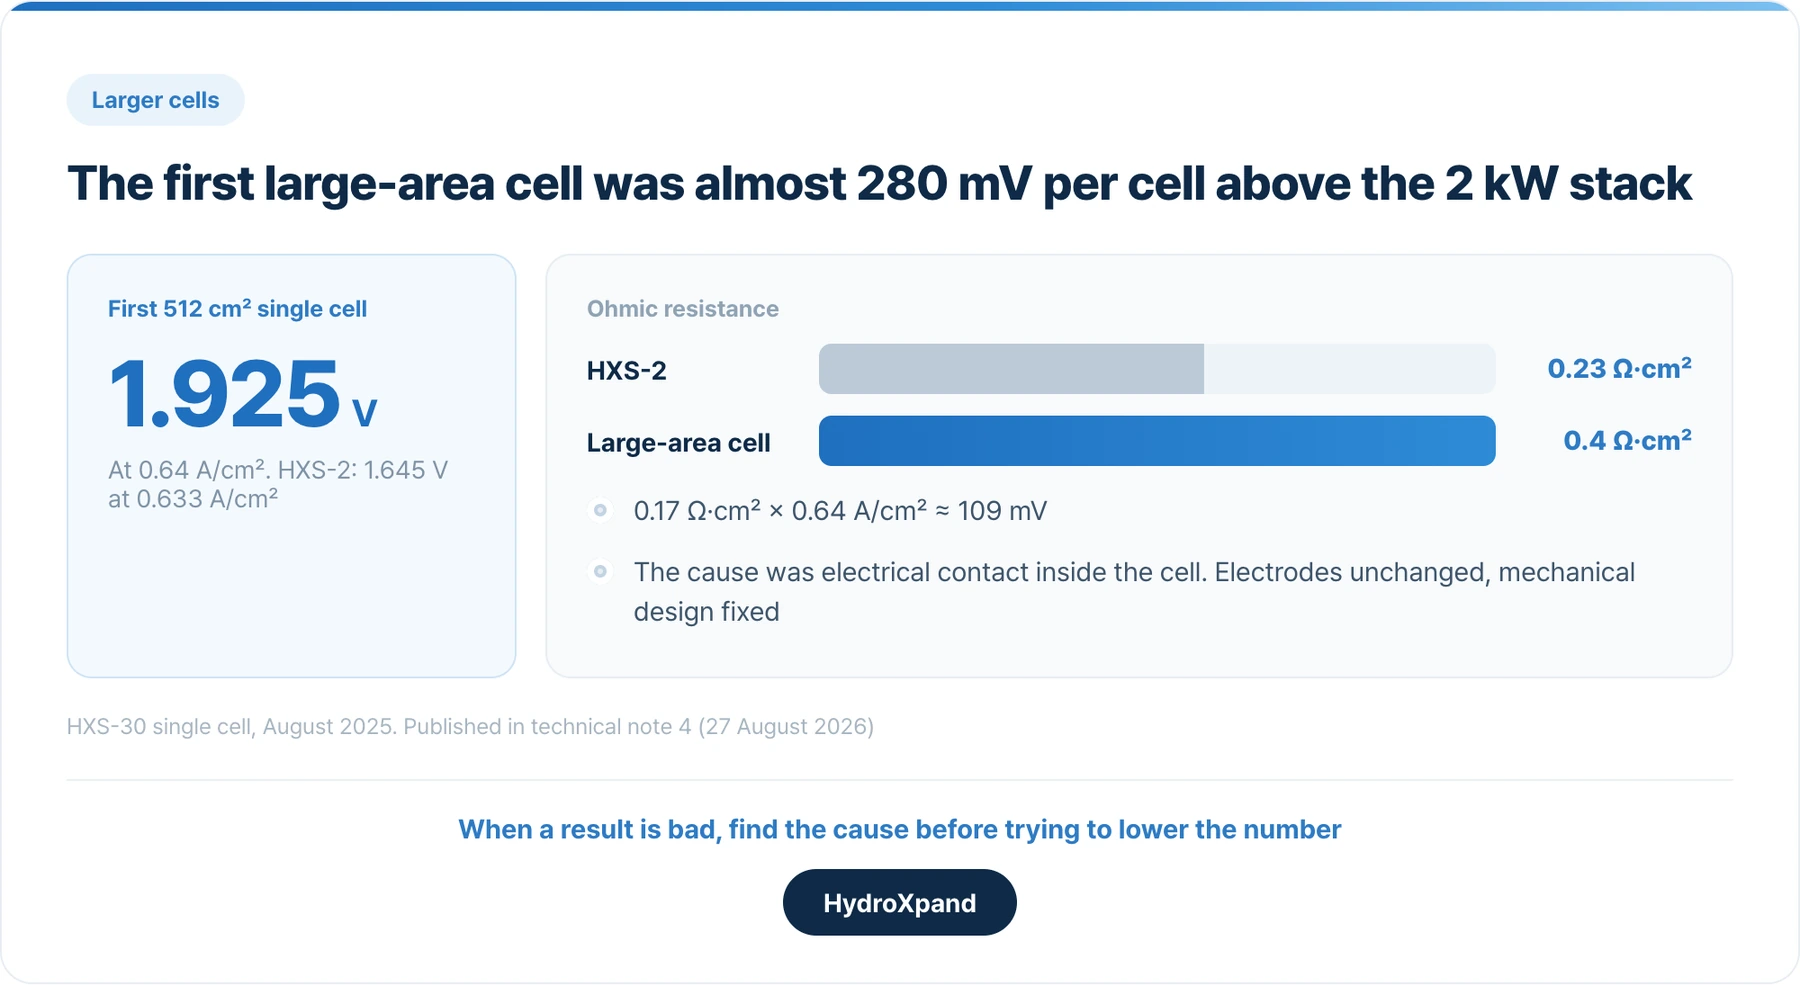
Resistance alone accounted for a large share of the gap, and the source was electrical contact inside the cell. On a larger face it is harder to press the whole cell evenly, and contact resistance builds up where the pressure is lower. We left the electrodes as they were and changed the mechanical design.
After the change, a five-cell short stack gave 1.634 V per cell at 360 A. Fifteen cells gave 1.660 V per cell at 360.6 A, or 0.704 A/cm². The fifteen-cell stack and the HXS-2 were run under the same conditions, 0.1 M KOH, 50 °C and ambient pressure, and both were at 1.645 V per cell at 0.645 A/cm². A cell 6.5 times larger was back on the same voltage curve as the small commercial cell.
The five-cell run was at 60 °C and its electrolyte concentration was not recorded, so we do not read the 26 mV per cell between it and the fifteen-cell run as a performance difference.
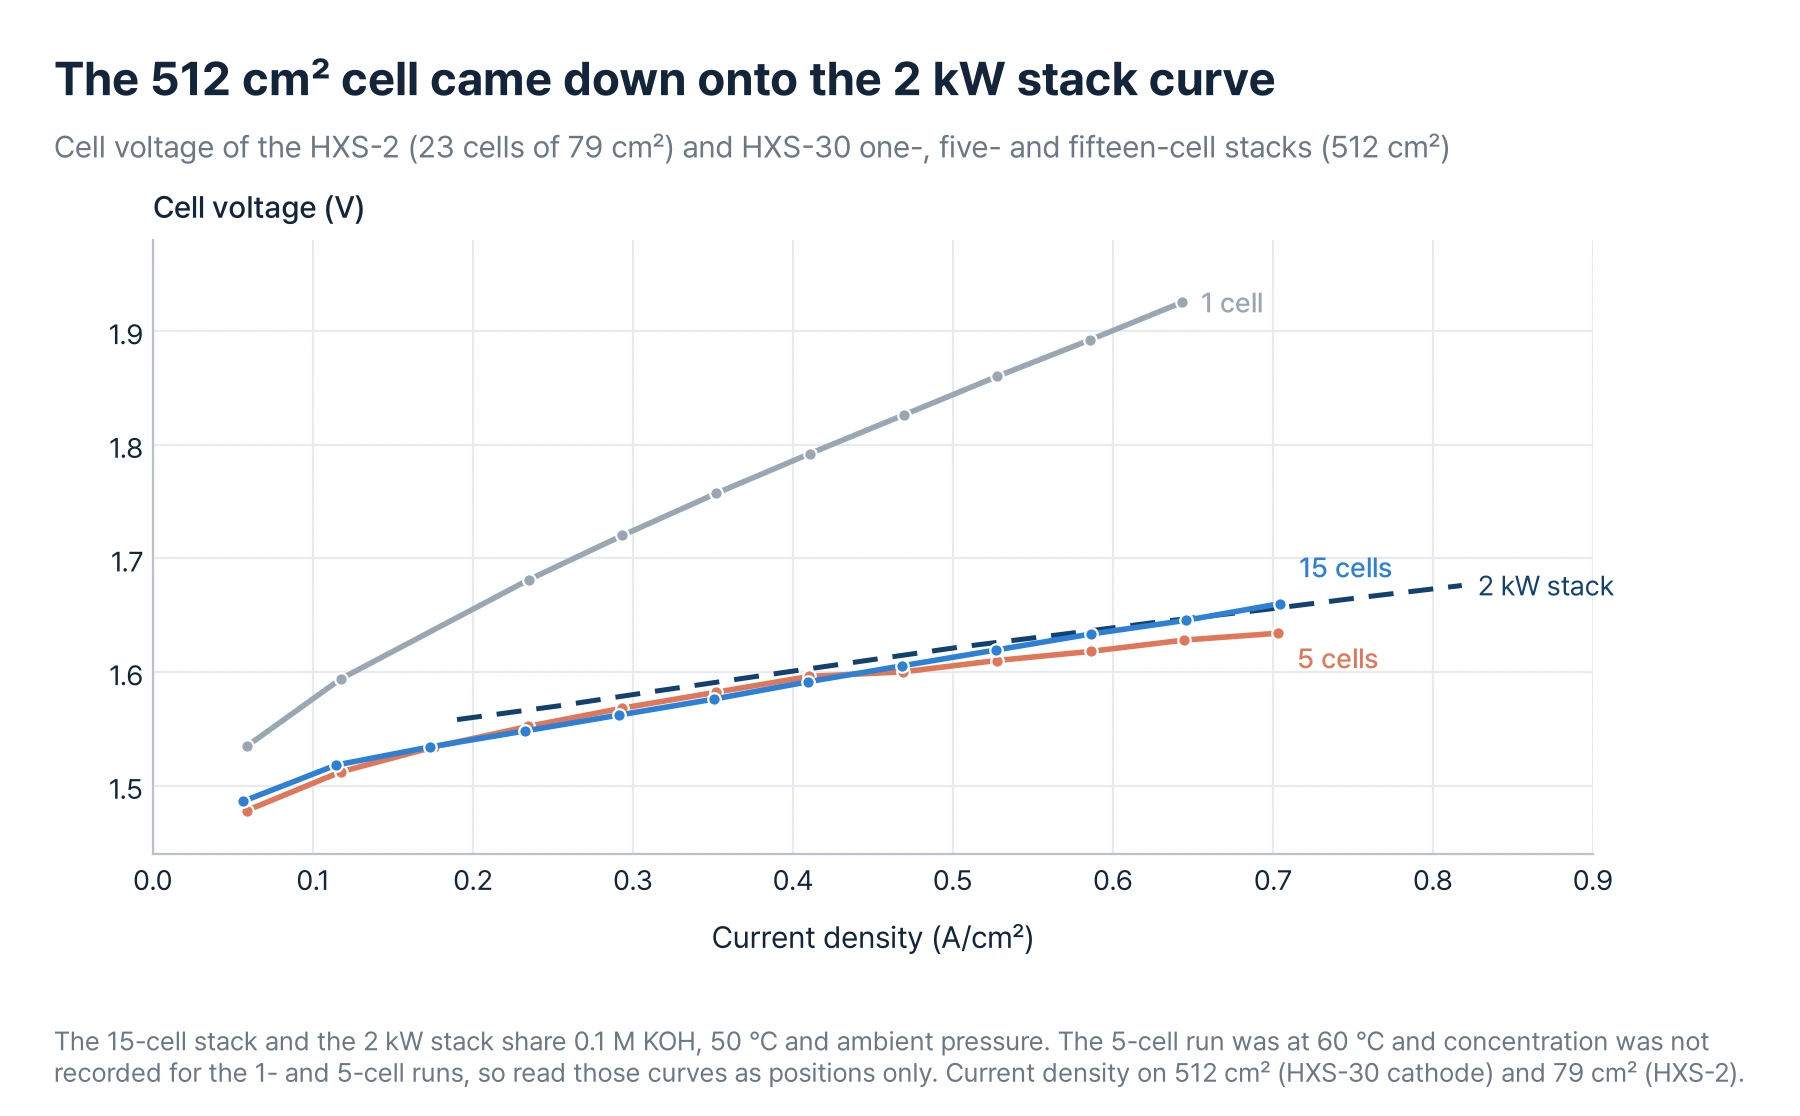
The fifteen-cell curve was close to a straight line over the whole range. When electrolyte cannot reach the corners or bubbles cannot escape, the curve bends upward at high current. There was no sign of that, so the mass-transport problem we worried about most on large cells did not appear in this current range.
- Our first large-area cell was worse than the stack we already sell→The technical note behind these figures.
More cells exposed the spread between them
With the area problem solved, we added cells. Measuring each cell individually, the spread grew at every step.
| Stage | Highest minus lowest cell | Conditions |
|---|---|---|
| 5 cells | 15 mV | 360 A, 60 °C |
| 15 cells | 40 mV | 360 A, 0.1 M KOH, 50 °C |
| 46 cells, start of run | 33.7 mV | about 360 A, 0.1 M KOH, 50 °C |
| 46 cells, after 96.7 hours | 74.3 mV | same |
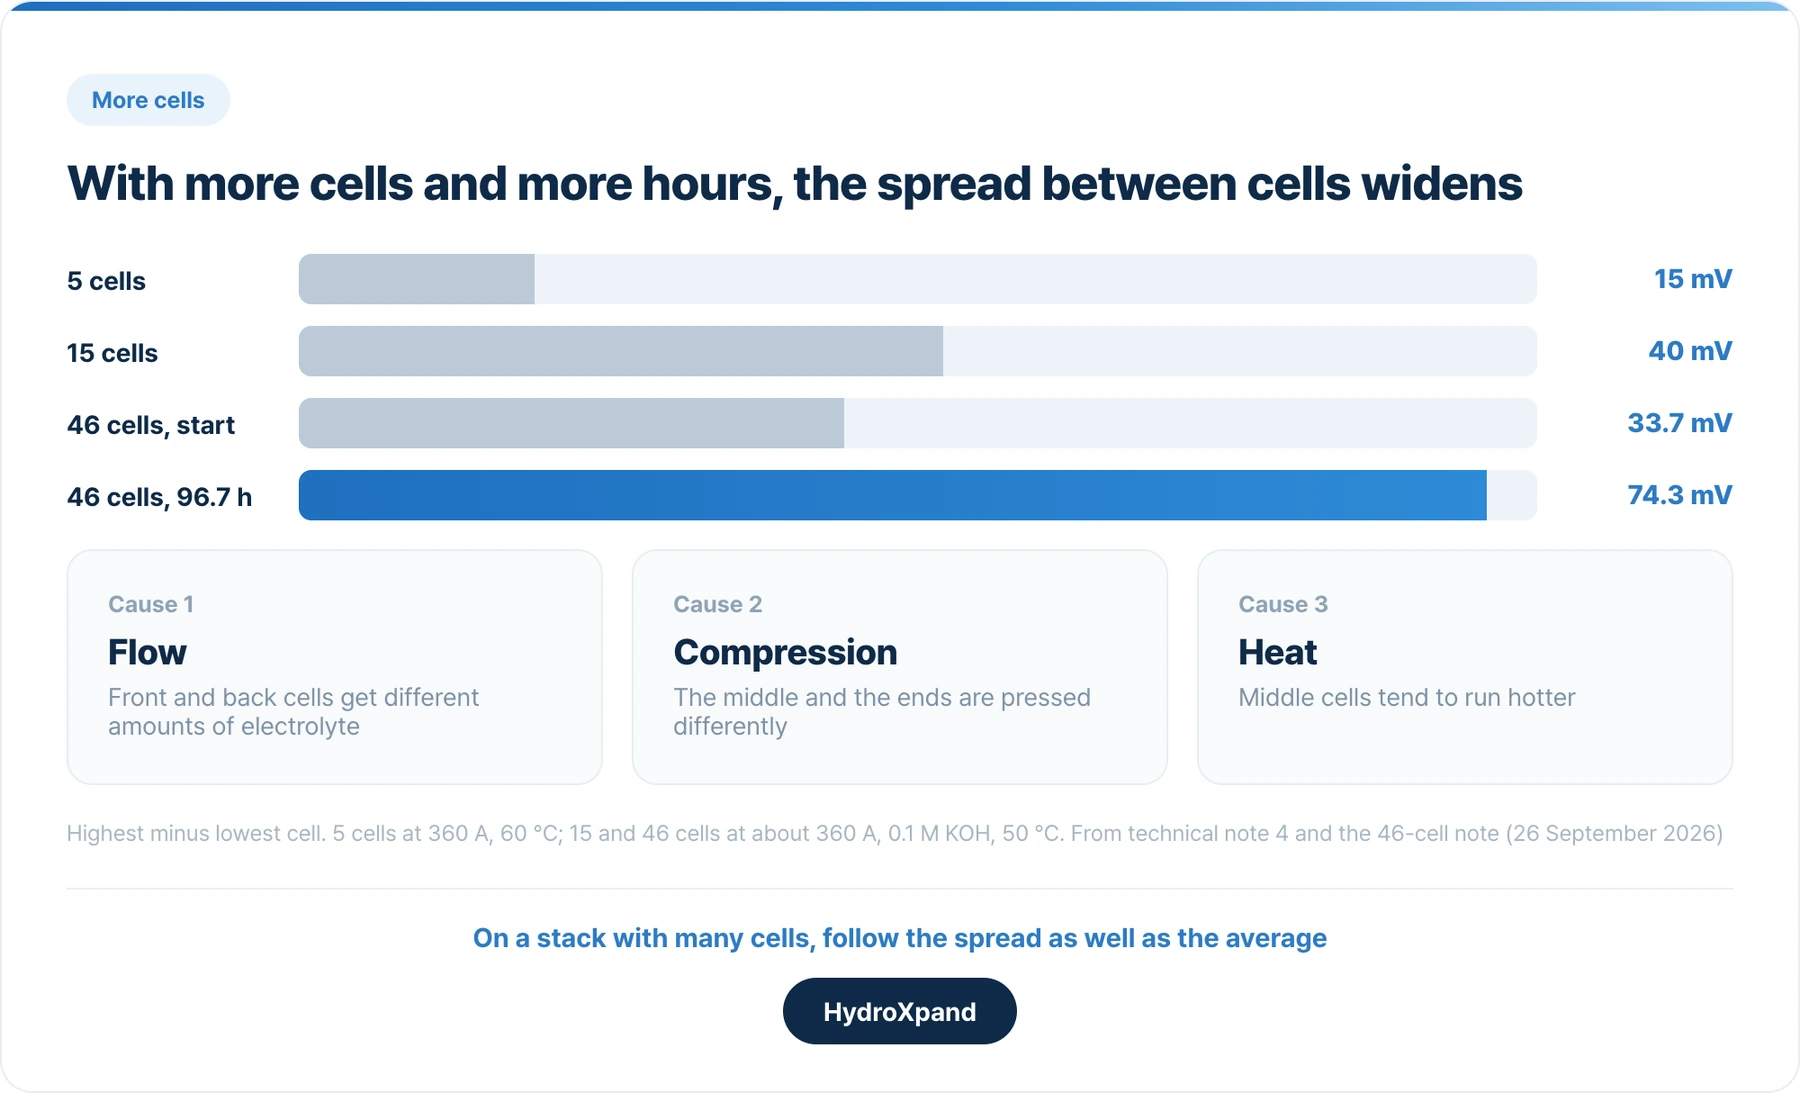
At the start of its run the 46-cell stack was actually more even than the fifteen-cell one. Over 96.7 hours, though, the spread widened as the average voltage rose.
The more cells there are, the more the cells near the ends and those in the middle tend to see different conditions:
- Flow. Electrolyte is split across many cells, and cells at the front and back receive different amounts.
- Compression. A long tie rod presses many cells at once, so the force in the middle differs from the force at the ends.
- Heat. Middle cells have less room to shed heat and tend to run hotter.
On a stack with many cells, track the spread as well as the average. The average can hold steady while a few cells climb ahead, and those cells set the life of the whole stack.
- Cell voltage distribution→What a stack voltage hides, and what to ask for.
An early voltage rise is not yet a degradation rate
Over 96.7 hours the 46-cell stack went from 1.658 to 1.761 V per cell, a rise of about 103 mV. That slope is steeper than in the fifteen-cell 293-hour record.
We do not turn that slope into a lifetime. Early in operation the voltage rises quickly and then settles, and a record shorter than 100 hours cannot separate that settling from continuing decline. The fifteen- and 46-cell runs also differ in length and cell frame, so the difference in slope cannot be put down to cell count alone.
- We have brought the 46-cell, 30 kW-class full stack into operation→The first 96.7 hours of the full stack.
- Why electrolyzer cells and stacks perform differently→What changes when cell results are carried over to a stack.
What to check in results for a large stack
| Item | Reason |
|---|---|
| How much the cell area and the cell count each grew | They go wrong in different places |
| A comparison curve with a smaller stack under the same concentration, temperature and pressure | Under different conditions the voltage gap between curves cannot be taken at face value |
| Whether the curve bends upward at high current | If it does, look at electrolyte flow and the path bubbles take out |
| Individual cell voltages and how their spread changes over time | The average alone does not show which cell is falling behind first |
| The time window and length used to calculate a voltage rise | A slope over the first tens of hours is not a degradation rate |
In short: when the cells grew, contact resistance was the first problem; when the cell count grew, it was the spread between cells. We fixed the contact problem with mechanical design, and fifteen cells gave the same voltage curve as the 2 kW stack. On the 46-cell stack the spread widens with operating time, and we are still following it. We will publish a long-term degradation rate for the 46-cell stack once the record is long enough.
- Building an electrolyzer stack in the lab→Where it fails, and how to tell which part.
- HXS-30→The 30 kW-class, 46-cell stack.
Frequently asked questions
Which is harder, larger cells or more cells?
For us, larger cells. With more cells you know in advance what to watch: assembly and uniformity. With larger cells the current distribution, electrolyte flow and bubble removal inside the cell all change. Our first 512 cm² single cell was almost 280 mV per cell above the commercial stack built from 79 cm² cells.
How do you find the cause when a large-area cell underperforms?
Look at the shape of the voltage curve and at impedance together. High ohmic resistance points first to contact or compression. Similar resistance but higher voltage from low current upward points to the catalyst. A curve that bends upward only at high current points to electrolyte supply or bubble removal.
Is the cell voltage of the 30 kW stack the same as the 2 kW stack?
Under the same 0.1 M KOH, 50 °C and ambient pressure, the fifteen-cell short stack was at 1.645 V per cell at 0.645 A/cm², the same as the HXS-2 at 0.633 A/cm². The initial curve of the 46-cell full stack sits close to the fifteen-cell curve.
What is the degradation rate of the 46-cell stack?
We have not published one yet. The record published so far is 96.7 hours, and it includes early settling. We will publish one with its time window and conditions once the record is longer.
Can we get the raw data?
On request we send individual cell voltages, stack voltage and current, and the operating conditions.
Looking at AEM for a specific application?