A material that does well in a single cell often gives higher cell voltage or faster degradation in a stack. Why performance and durability differ between cells and stacks, and what to check when you review a stack from single-cell results.
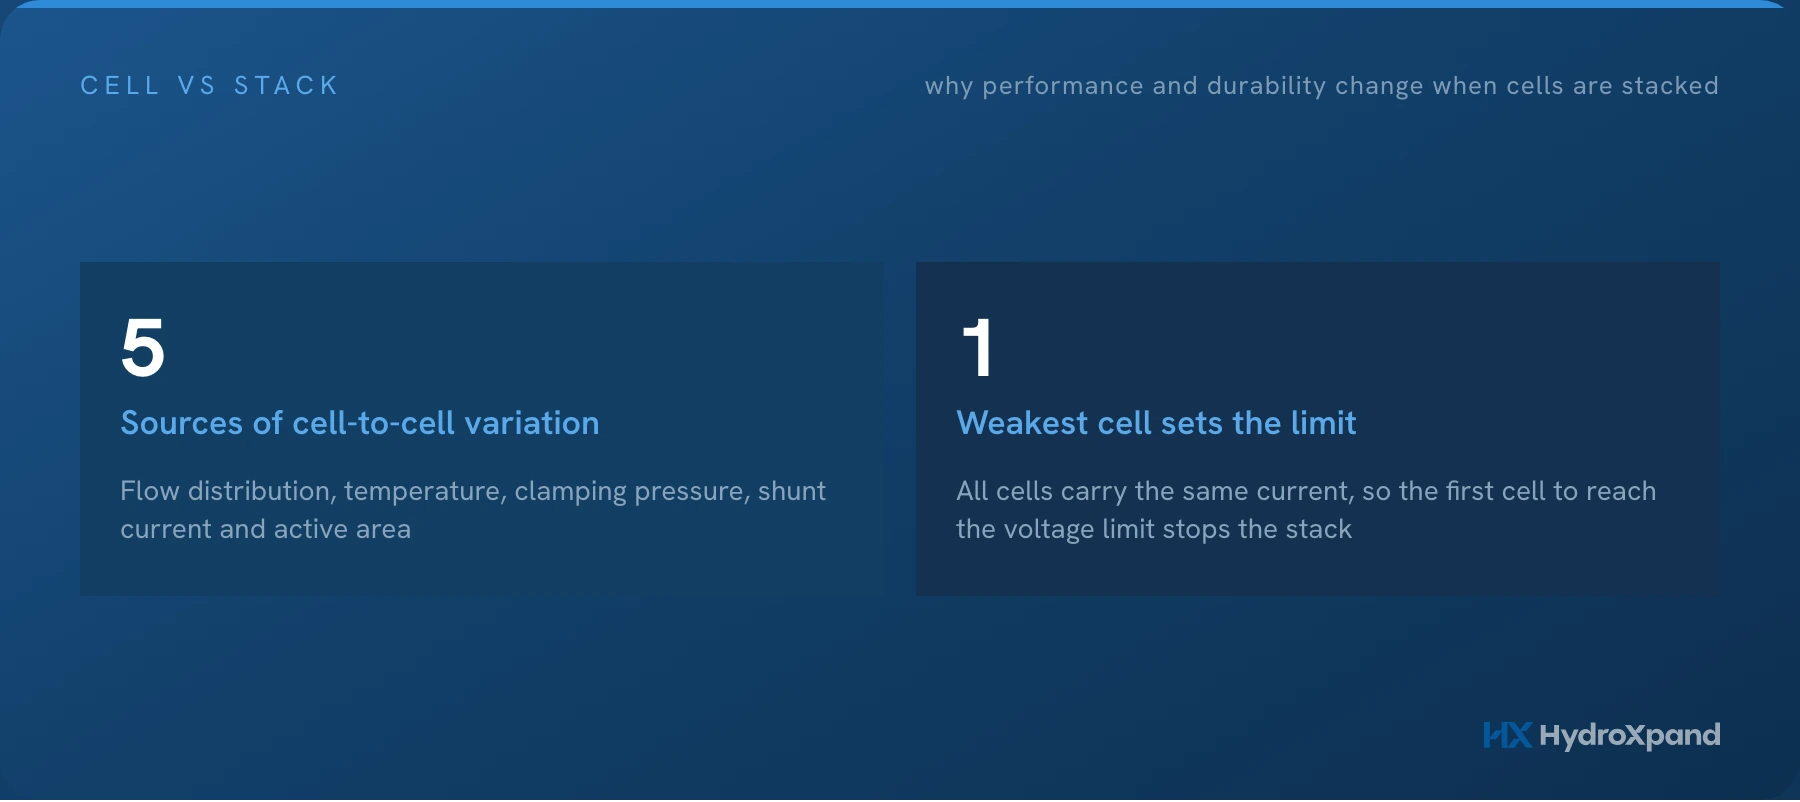
New electrodes and membranes are usually tested in a single cell first. A single cell is easy to control and gives results quickly. When the same materials go into a stack, however, the voltage per cell is often higher and degradation is often faster. The materials are the same; the environment each cell sits in is not.
This article explains why cell and stack results differ, for performance and for durability, and lists what to check when you review a stack from single-cell results.
- Do not compare the average cell voltage of a stack directly with a single-cell voltage. A stack adds variation in flow, temperature and clamping pressure.
- Check the spread in cell voltage as well as the average. A stack with the same average but a wider spread will have a shorter life.
- Judge by the weakest cell. A stack reaches its operating limit at the cell that degrades first.
- Ask for a stack-level durability record. A single-cell record does not stand in for stack life.

How a single cell and a stack differ
| Item | Single cell | Stack |
|---|---|---|
| Number of cells | One | A few to several dozen, connected in series |
| Electrolyte feed | Direct to one cell | Split between cells through a manifold |
| Temperature | Held constant by an external heater | Heat generation and loss depend on cell position |
| Clamping | A small area, clamped evenly | A large area and many cells, clamped at once |
| Electrical path | Current through one cell | The same current through every cell, plus bypass paths through the electrolyte |
A single-cell test measures the materials. A stack adds the variation that comes from stacking many cells. Most of the gap between cell and stack results comes from that variation.
Why performance differs
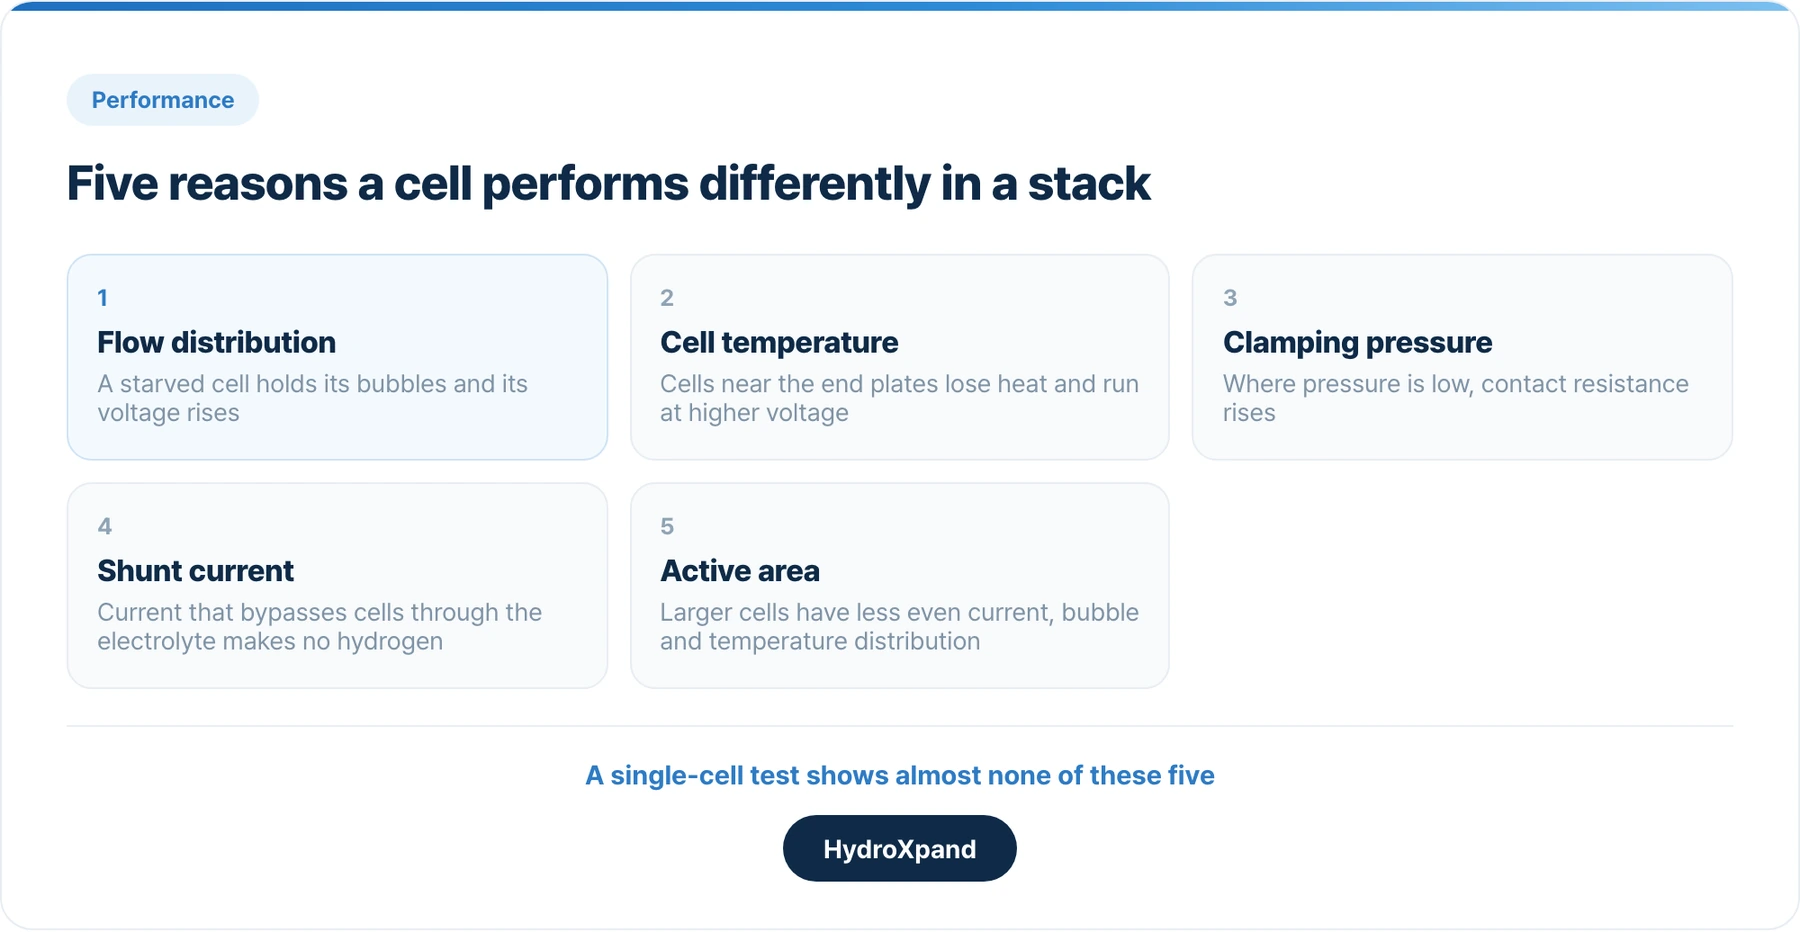
Flow distribution. Electrolyte enters through a manifold and is divided between the cells. Cells near the inlet and far from it can receive different flow. In a starved cell, bubbles do not clear and cover the electrode surface, and the cell voltage rises.
Cell temperature. Cells in the middle of a stack receive heat from their neighbours; cells near the end plates lose heat to the outside. At the same current, cells run at different temperatures, and a cooler cell runs at higher voltage. A single-cell test uses an external heater, so this difference does not appear.
Clamping pressure. A stack is clamped with end plates and bolts in one go. The larger the area and the more cells, the harder it is to apply pressure evenly. Where pressure is low, contact resistance rises; where it is too high, the membrane or gasket can be damaged.
Shunt current. The cells share the same electrolyte manifold, and the electrolyte conducts, so part of the current bypasses cells through the electrolyte. This shunt current produces no hydrogen and lowers stack efficiency. A single cell has no bypass path, so the loss does not appear.
Active area. Test cells are usually a few to a few tens of square centimetres; stack cells are much larger. Over a larger area, current, bubbles and temperature are less evenly distributed, and at the same current density a large cell often runs at a higher average voltage than a small one.
Why durability differs
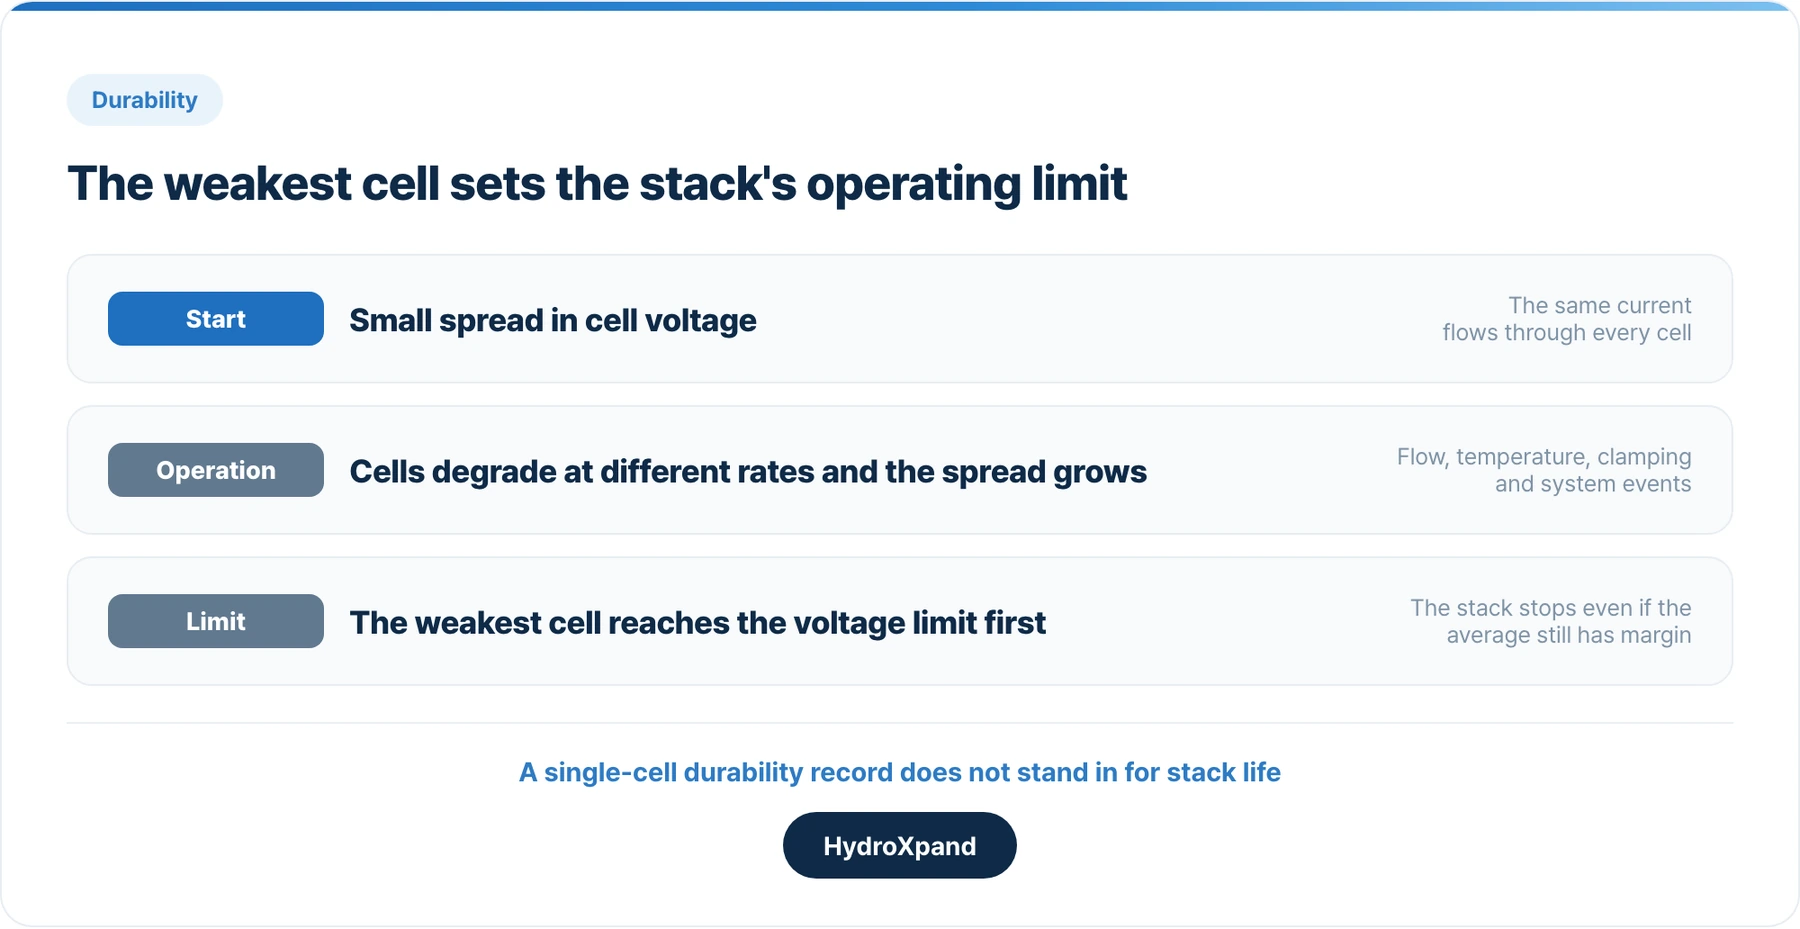
The weakest cell sets the stack's life. The cells are in series, so every cell carries the same current. Conditions differ slightly from cell to cell, and so does the rate of degradation. As operating time builds up, the spread in cell voltage widens, and the cell that degrades fastest reaches the voltage limit first. A stack can have to stop because of one cell while its average voltage still has margin.
System events are recorded in the stack. A stack runs with a power supply, pumps, a heater and a make-up water supply. Temperature changes when make-up water enters, changes in circulation flow, and stops and restarts all affect the stack. A single-cell test bench is managed so that such events hardly occur, which is one reason the same materials often give a shorter durability result in a stack.
Starts and stops act differently on each cell. Each stop and restart brings a large swing in cell voltage and temperature. Cells recover temperature and refill with electrolyte at different rates depending on position, so the same stop puts a different load on each cell.
Telling the causes apart in the lab
If you test stacks or short stacks yourself, the following methods separate most of the factors that raise cell voltage.
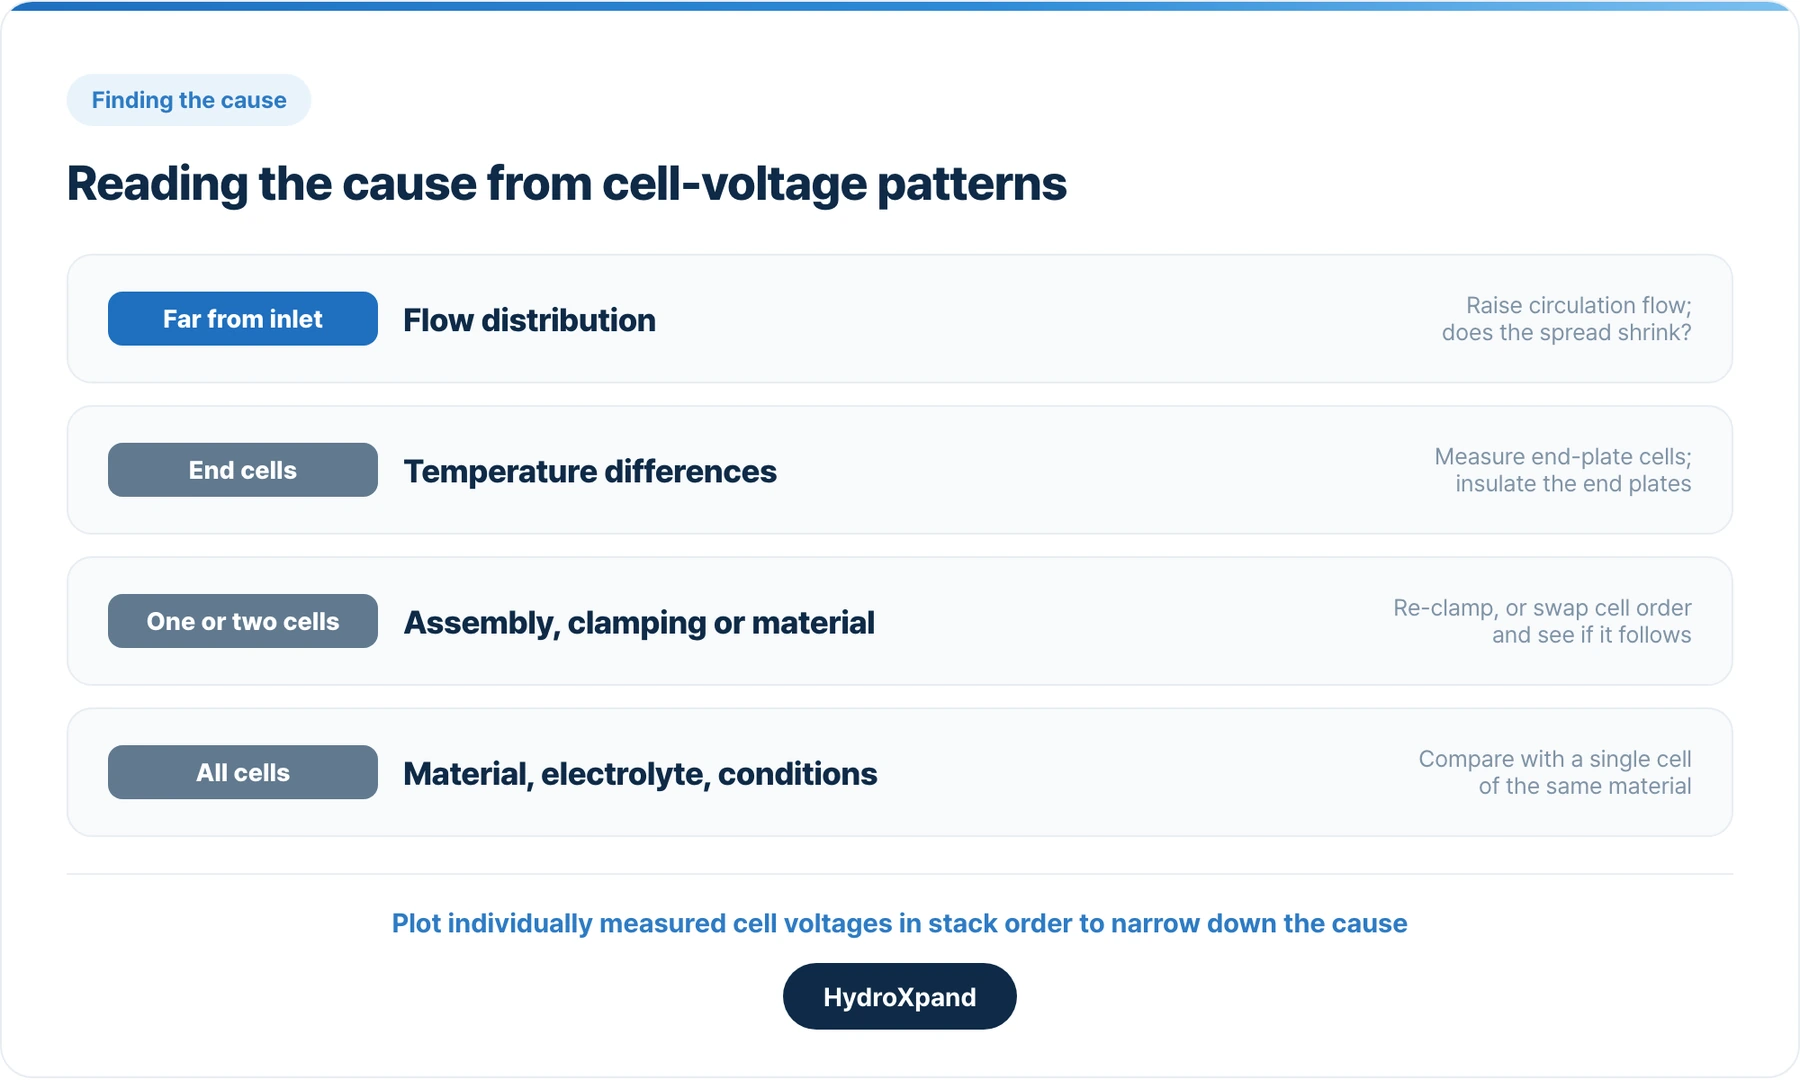
Plot cell voltage by position. Measure each cell individually and plot the voltages in stack order. Different causes leave different patterns.
| Pattern | Likely cause | How to check |
|---|---|---|
| Voltage rises with distance from the electrolyte inlet | Flow distribution | Raise circulation flow and see whether the spread shrinks |
| End cells run higher than middle cells | Temperature differences between cells | Measure temperature at the end plates and in the middle, or insulate the end plates |
| One or two cells run high | Assembly, clamping or material variation | Re-clamp and see whether the same cells stay high, or swap cell order and see whether the problem follows |
| All cells run uniformly high | Material, electrolyte or operating conditions | Compare with a single cell of the same material under the same conditions |
Estimate the temperature effect at a few millivolts per degree. In our HXS-2 long-term record, a 1 °C drop in stack inlet temperature raised cell voltage by about 6–8 mV. On that basis, end cells running 3 °C cooler than the middle cells would sit about 20 mV higher. If the spread between cells is of that order, check the temperature distribution before blaming the material.
Check shunt current and crossover through hydrogen output. The theoretical hydrogen output of an N-cell stack at current I is N × I ÷ 2F, where F is the Faraday constant, 96,485 C/mol. A 23-cell stack at 50 A should produce about 480 NL/h (0 °C, 1 atm). If the measured dry hydrogen flow is lower, the difference comes from shunt current, crossover and leaks. These losses take a larger share at lower current, so measuring at several currents helps narrow down the cause.
Put a short stack between the single cell and the full stack. Rather than moving straight from single-cell results to a full stack, check first in a short stack of a few cells. You need at least three cells to tell the end cells from a middle cell. Measure each cell voltage and, if you can, the temperature by position. Distribution, temperature and clamping effects show up at much lower cost than in a full stack.
- More than 3,000 hours on an electrolyzer stack→Where the 6–8 mV per °C comes from.
What to check when reviewing a stack from cell results
| Item | Reason |
|---|---|
| Stack polarisation curve | The single-cell curve plus distribution, temperature and shunt losses |
| Spread in cell voltage | The average alone says nothing about uniformity |
| Stack-level durability record | A single-cell record does not stand in for stack life |
| Active area per cell | The larger the gap between test cell and stack cell, the larger the difference in results |
| System conditions | Check that circulation, temperature control and make-up water supply match |

- Why cell voltage distribution matters→How to measure the spread between cells.
- Building a stack in the lab→Clamping, sealing, distribution and alignment.
- More than 3,000 hours on an electrolyzer stack→An example of a stack-level durability record.
Why we publish stack data separately
We sell electrodes (HXP-an, HXP-ca) and stacks (HXS-2). Electrode data come from single-cell and short-stack tests; stack data come from full stacks running inside a system. We measure them separately because cell results do not carry over to a stack unchanged.
If you are reviewing a stack, you can check the stack-level polarisation curve and cumulative operating record for the HXS-2. If you would like to compare results from your own cells or stacks, contact us with the test conditions.
- HXS-2 stack→Specifications and polarisation curve.
Frequently asked questions
Why is the voltage per cell higher in a stack than in a single cell?
A stack adds flow distribution, temperature differences between cells, uneven clamping pressure and shunt current to the materials' own losses. Larger active area also makes current and bubble distribution less even.
Does a long single-cell durability test predict stack life?
No. Stack life is set by the weakest cell and by events in the surrounding system, neither of which appears in a single-cell test. Ask for a stack-level record.
What is shunt current?
Cells in a stack share an electrolyte manifold, and because the electrolyte conducts, some current bypasses cells through it. That current produces no hydrogen and lowers stack efficiency.
How many cells should a short stack have?
At least three, so that the end cells can be told apart from a middle cell. More cells show distribution and temperature effects more clearly; whatever the count, make sure each cell voltage can be measured individually.
What should I ask a supplier for besides average cell voltage?
The stack polarisation curve, the spread in cell voltage, a stack-level durability record with its conditions, the active area per cell and the system conditions used in the test.
Looking at AEM for a specific application?