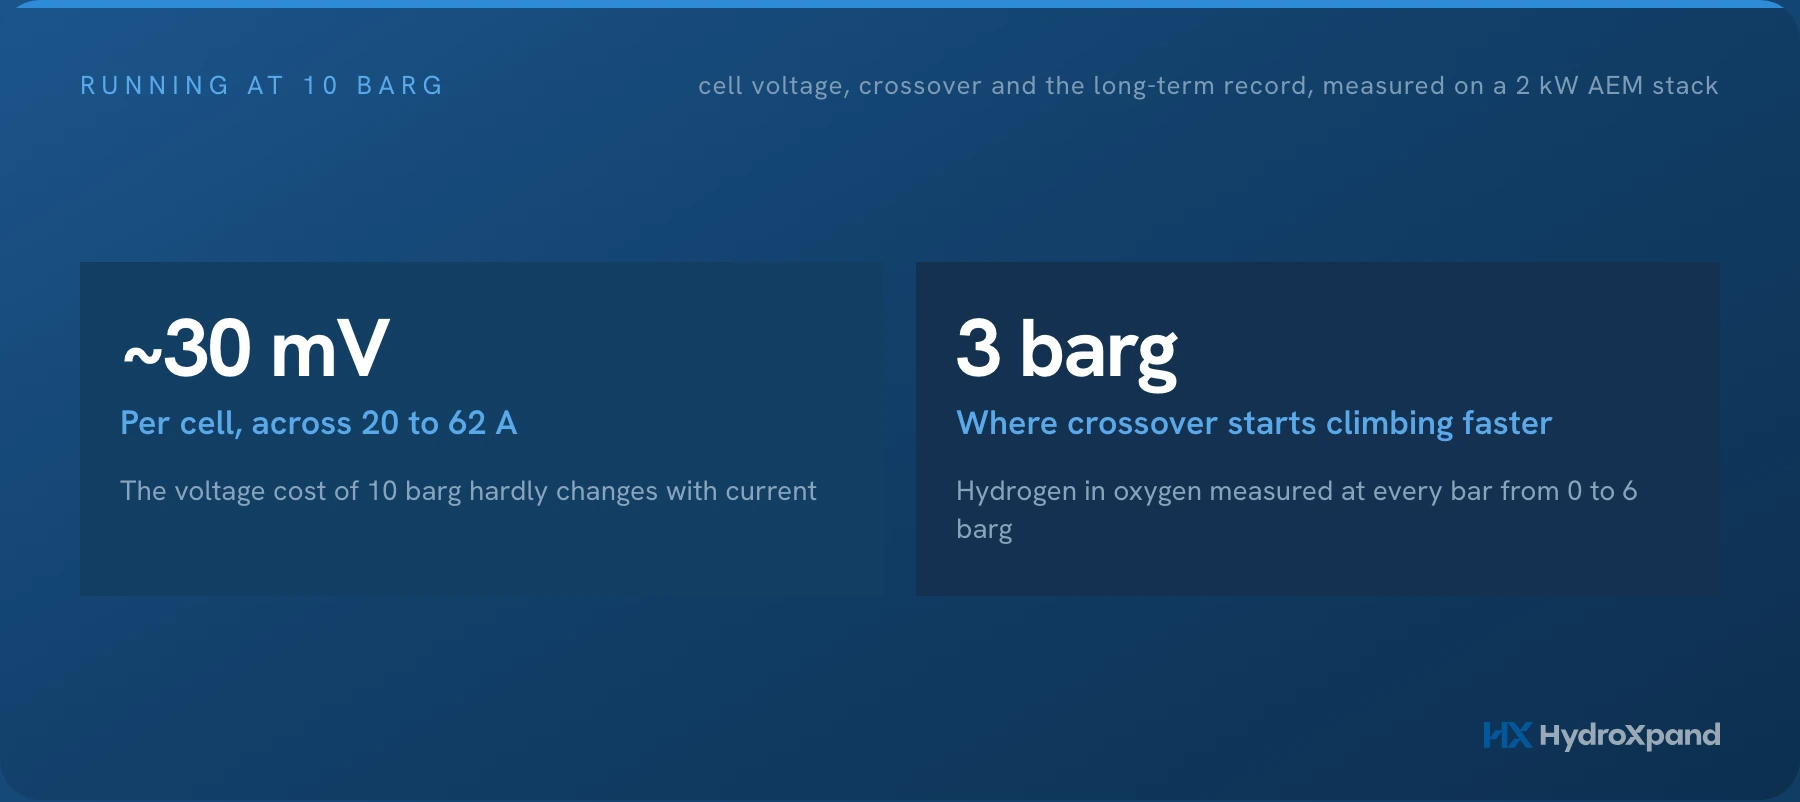
Raise the pressure only as far as you need. At 10 barg cell voltage goes up by about 30 mV per cell, which is small, but hydrogen in oxygen grows faster once pressure passes 3 barg. Measured on our 2 kW stacks, with the long-term record so far.
Running the hydrogen outlet at 10 barg lets you supply low-pressure storage or a downstream gas line without a compressor. Whether to keep a compressor is covered in our article on compressors. This article looks at what changes inside the stack once you have chosen pressurised operation, using measurements on our 2 kW, 23-cell stacks.
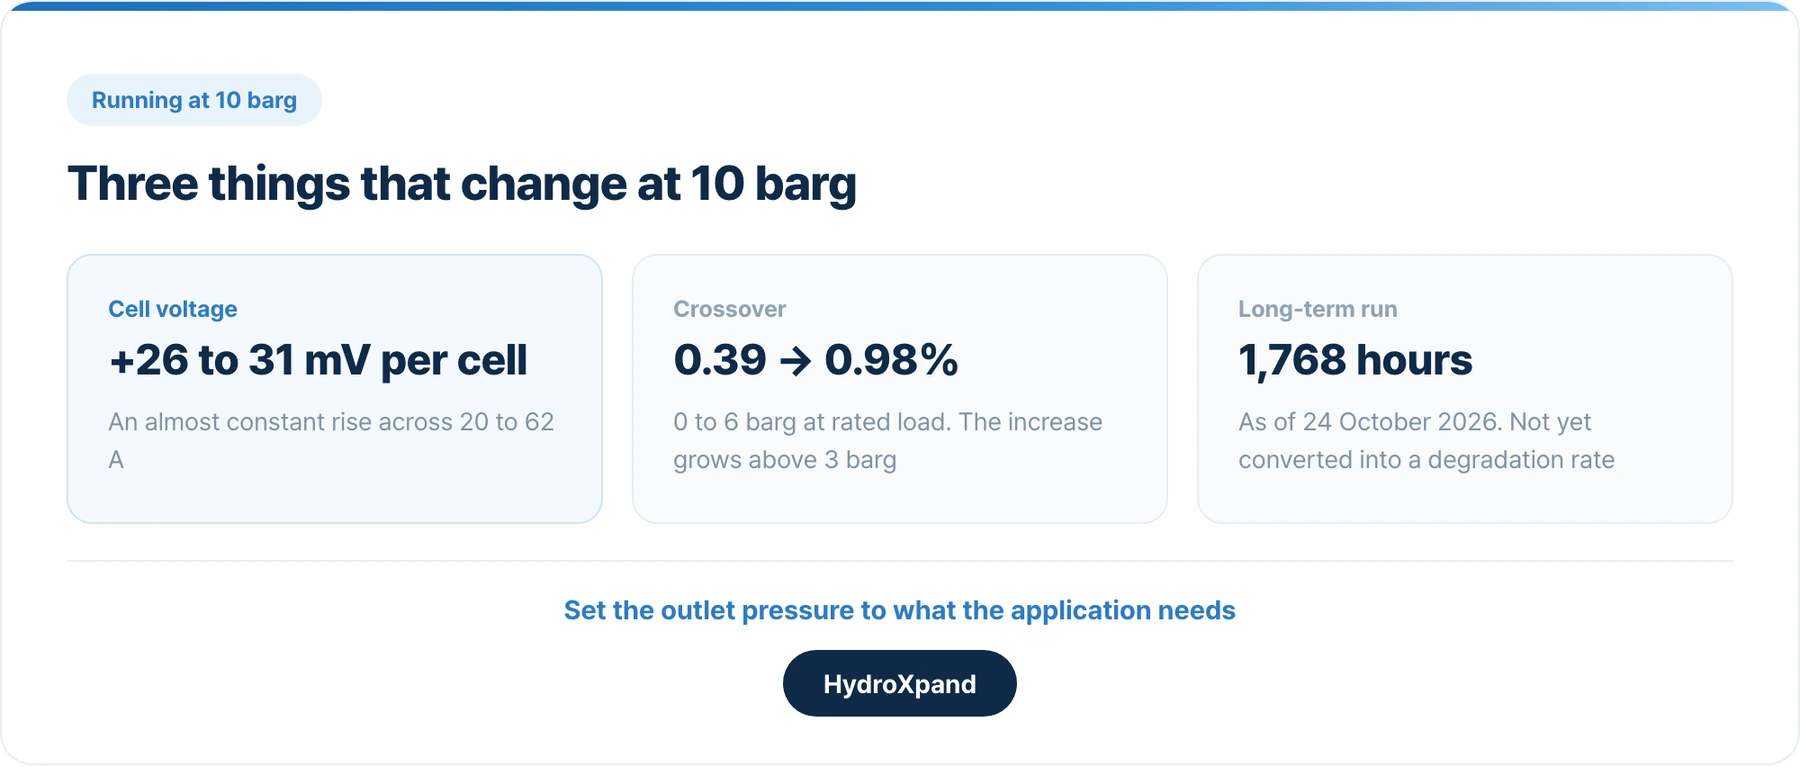
The short answer: raise the pressure only as far as you need. The voltage cost is small, but above 3 barg crossover starts to grow faster.
- Set the outlet pressure to what you actually need. If 3 barg or less will do, there is little reason to go higher.
- Take the voltage cost as about 30 mV per cell. It is almost the same at your operating current as at rated 50 A.
- Check crossover at the pressure you will run. In our measurements the increase per bar grew above 3 barg.
- Ask separately for a degradation rate at pressure. The 10 barg on a datasheet is a pressure rating, not a lifetime condition.
Cell voltage rises by about 30 mV per cell
We ran the same HXS-2 23-cell stack at ambient and at 10 barg, in 0.1 M KOH at 50 °C. During the sweep back-pressure fell from 10.4 to 7.3 barg, so the 10 barg values are corrected to 10 barg.
| Current | Ambient cell voltage | 10 barg cell voltage | Difference per cell | Relative to ambient |
|---|---|---|---|---|
| 20 A | 1.584 V | 1.613 V | 29 mV | 1.8% |
| 30 A | 1.610 V | 1.640 V | 30 mV | 1.9% |
| 40 A | 1.634 V | 1.663 V | 29 mV | 1.8% |
| 50 A | 1.657 V | 1.685 V | 28 mV | 1.7% |
| 60 A | 1.678 V | 1.705 V | 26 mV | 1.6% |
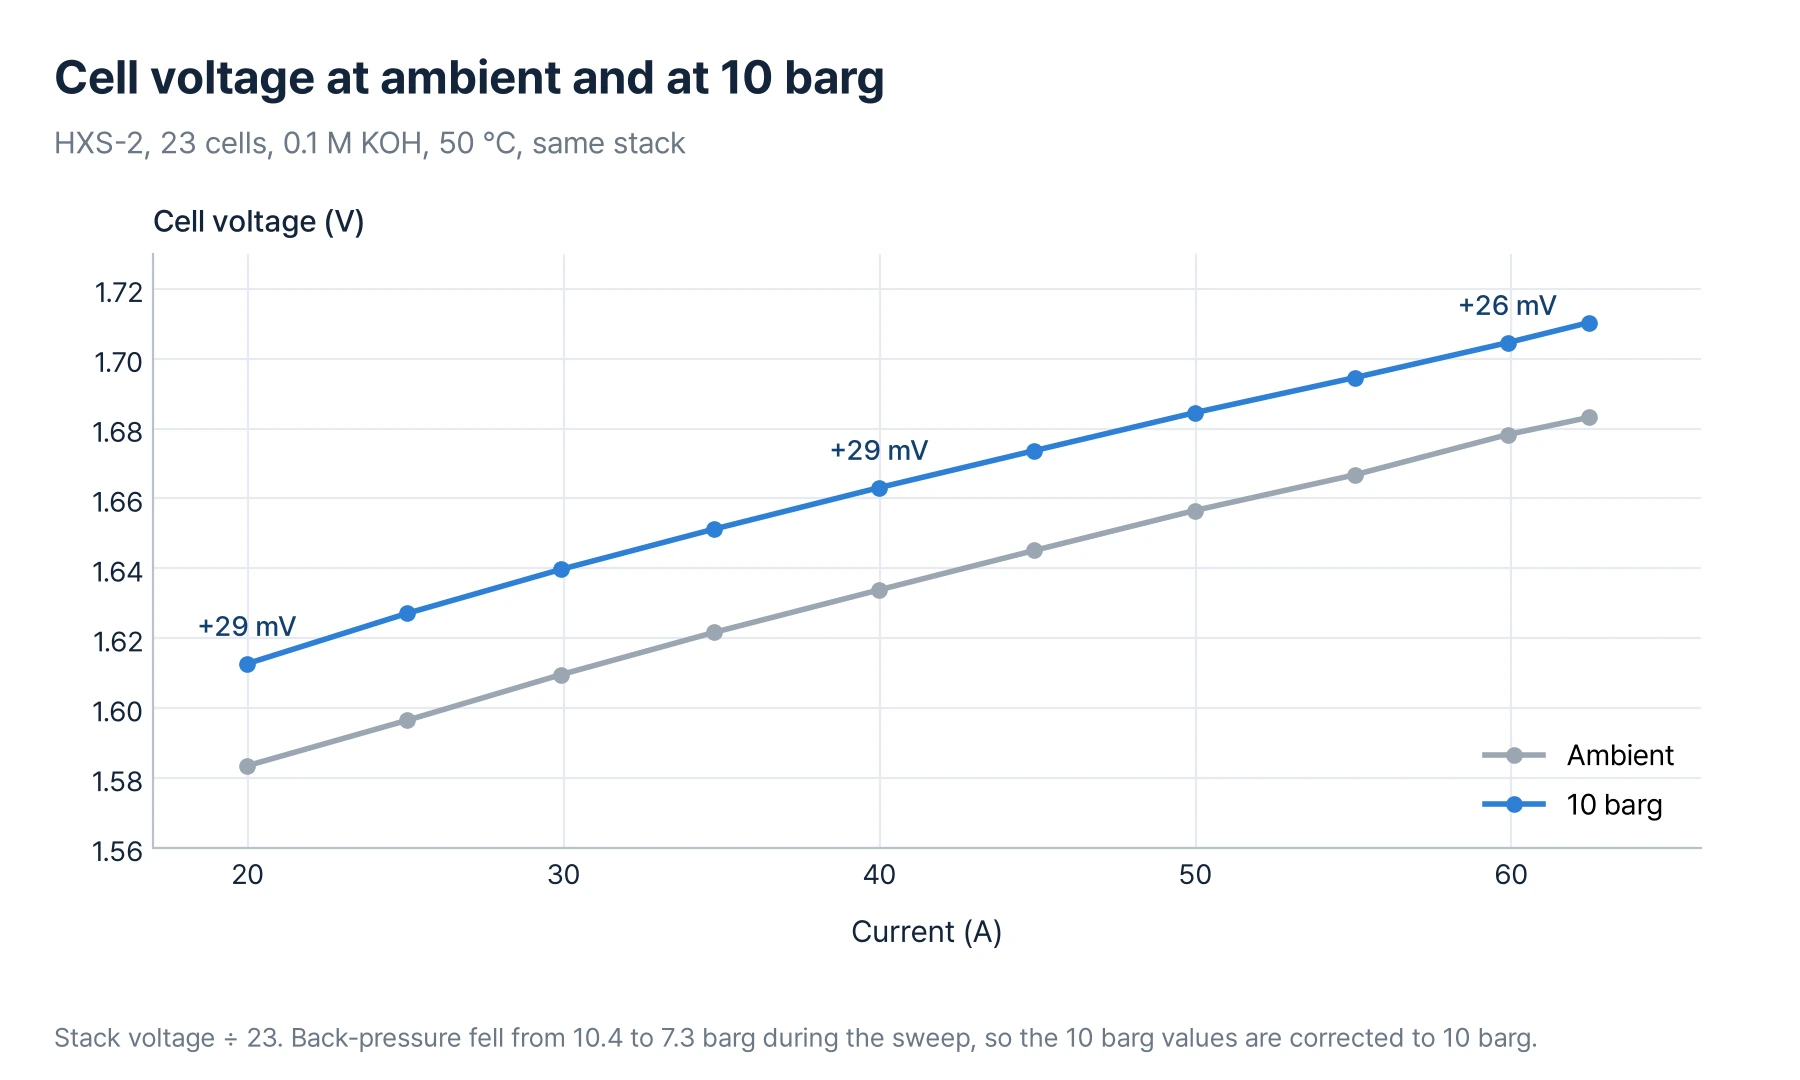
From 20 A to 62 A the difference stayed at 26 to 31 mV per cell. The higher the pressure of the hydrogen produced, the higher the minimum voltage needed to split water; the Nernst equation puts it at about 33 mV per cell at 50 °C and 10 barg. That difference does not depend on current, which matches what we measured.
As a percentage it is slightly larger at low current, because the difference is similar while the cell voltage itself is lower. If you plan long periods at part load, work out power consumption from the percentage at your operating current rather than the 1.7% at rated current.
Crossover grows faster above 3 barg
In AEM electrolysis, some of the hydrogen made at the cathode crosses the membrane and mixes into the oxygen at the anode. This is crossover, tracked as hydrogen in oxygen. The higher the hydrogen-side pressure, the more hydrogen crosses.
On a different HXS-2 23-cell stack we raised the pressure from 0 to 6 barg in 1 bar steps. Below are rated load and 40% load from the 49 points measured from 50 A down to 20 A at each pressure.
| Hydrogen-side pressure | Rated load (50 A) | 40% load (20 A) |
|---|---|---|
| 0 barg (ambient) | 0.39% | 0.66% |
| 1 barg | 0.37% | 0.71% |
| 2 barg | 0.43% | 0.81% |
| 3 barg | 0.52% | 1.00% |
| 4 barg | 0.66% | 1.28% |
| 5 barg | 0.81% | 1.54% |
| 6 barg | 0.98% | 1.75% |
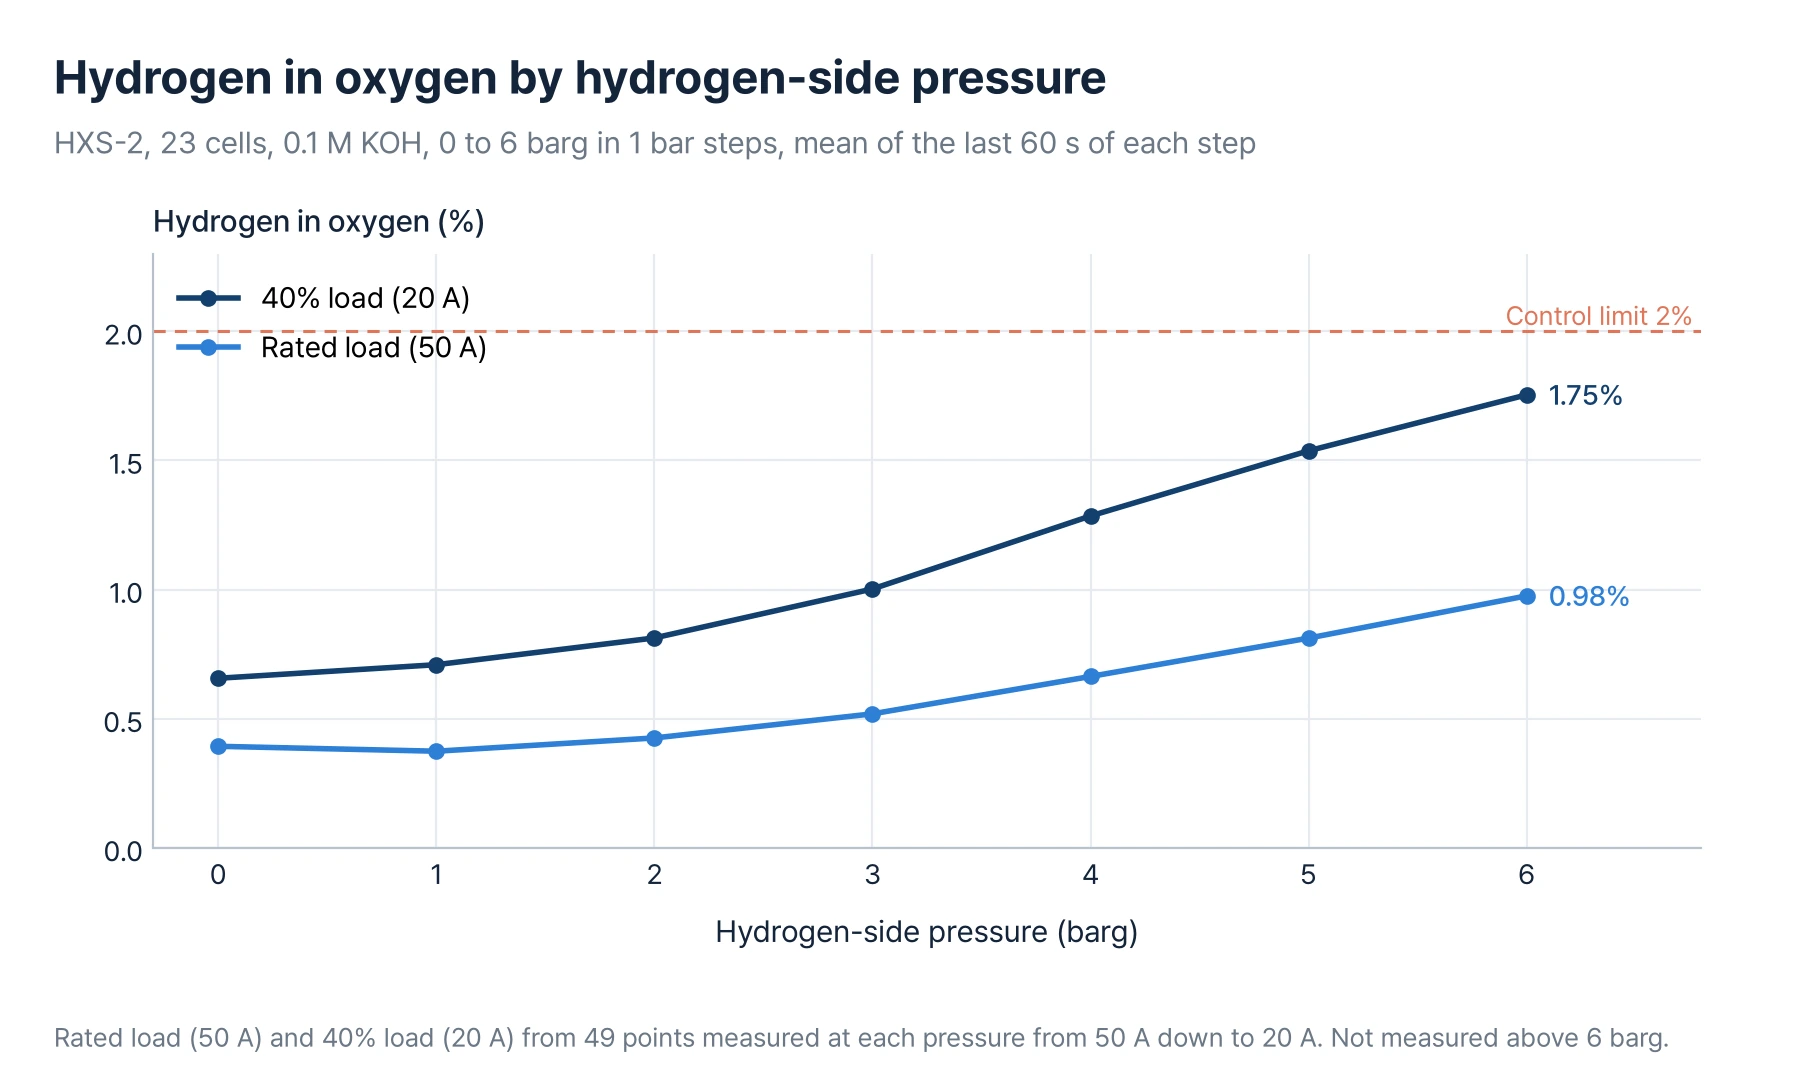
From 0 to 2 barg the rated-load concentration rose by only 0.04 percentage points. Above 3 barg it rises by 0.14 to 0.17 points per bar, and by more than 0.2 points per bar at 40% load. That is why, if 3 barg or less is enough for your outlet, there is little reason to run higher.
It did not rise in proportion to pressure. From 0 to 6 barg absolute pressure goes from about 1 bar to 7 bar, seven times, while the concentration went from 0.39% to 0.98%, 2.5 times. Some hydrogen crosses at ambient too.
This test stopped at 6 barg, so the table cannot tell you the values between 6 and 10 barg. How the concentration changes as load drops is covered in a separate article.
- Why hydrogen in oxygen rises at part load→The same 49 points read along the load axis.
Too early for a degradation rate
The constant-current long-term run at 10 barg and 50 A uses the stack from the voltage comparison above, in 0.1 M KOH at 50 °C. As of 24 October 2026 it stands at 1,768 hours, counting only the time 50 A was flowing.
| Item | Start | 24 October |
|---|---|---|
| Cell voltage | 1.691 V | 1.823 V |
| Hydrogen in oxygen | 1.00% | 1.38% |
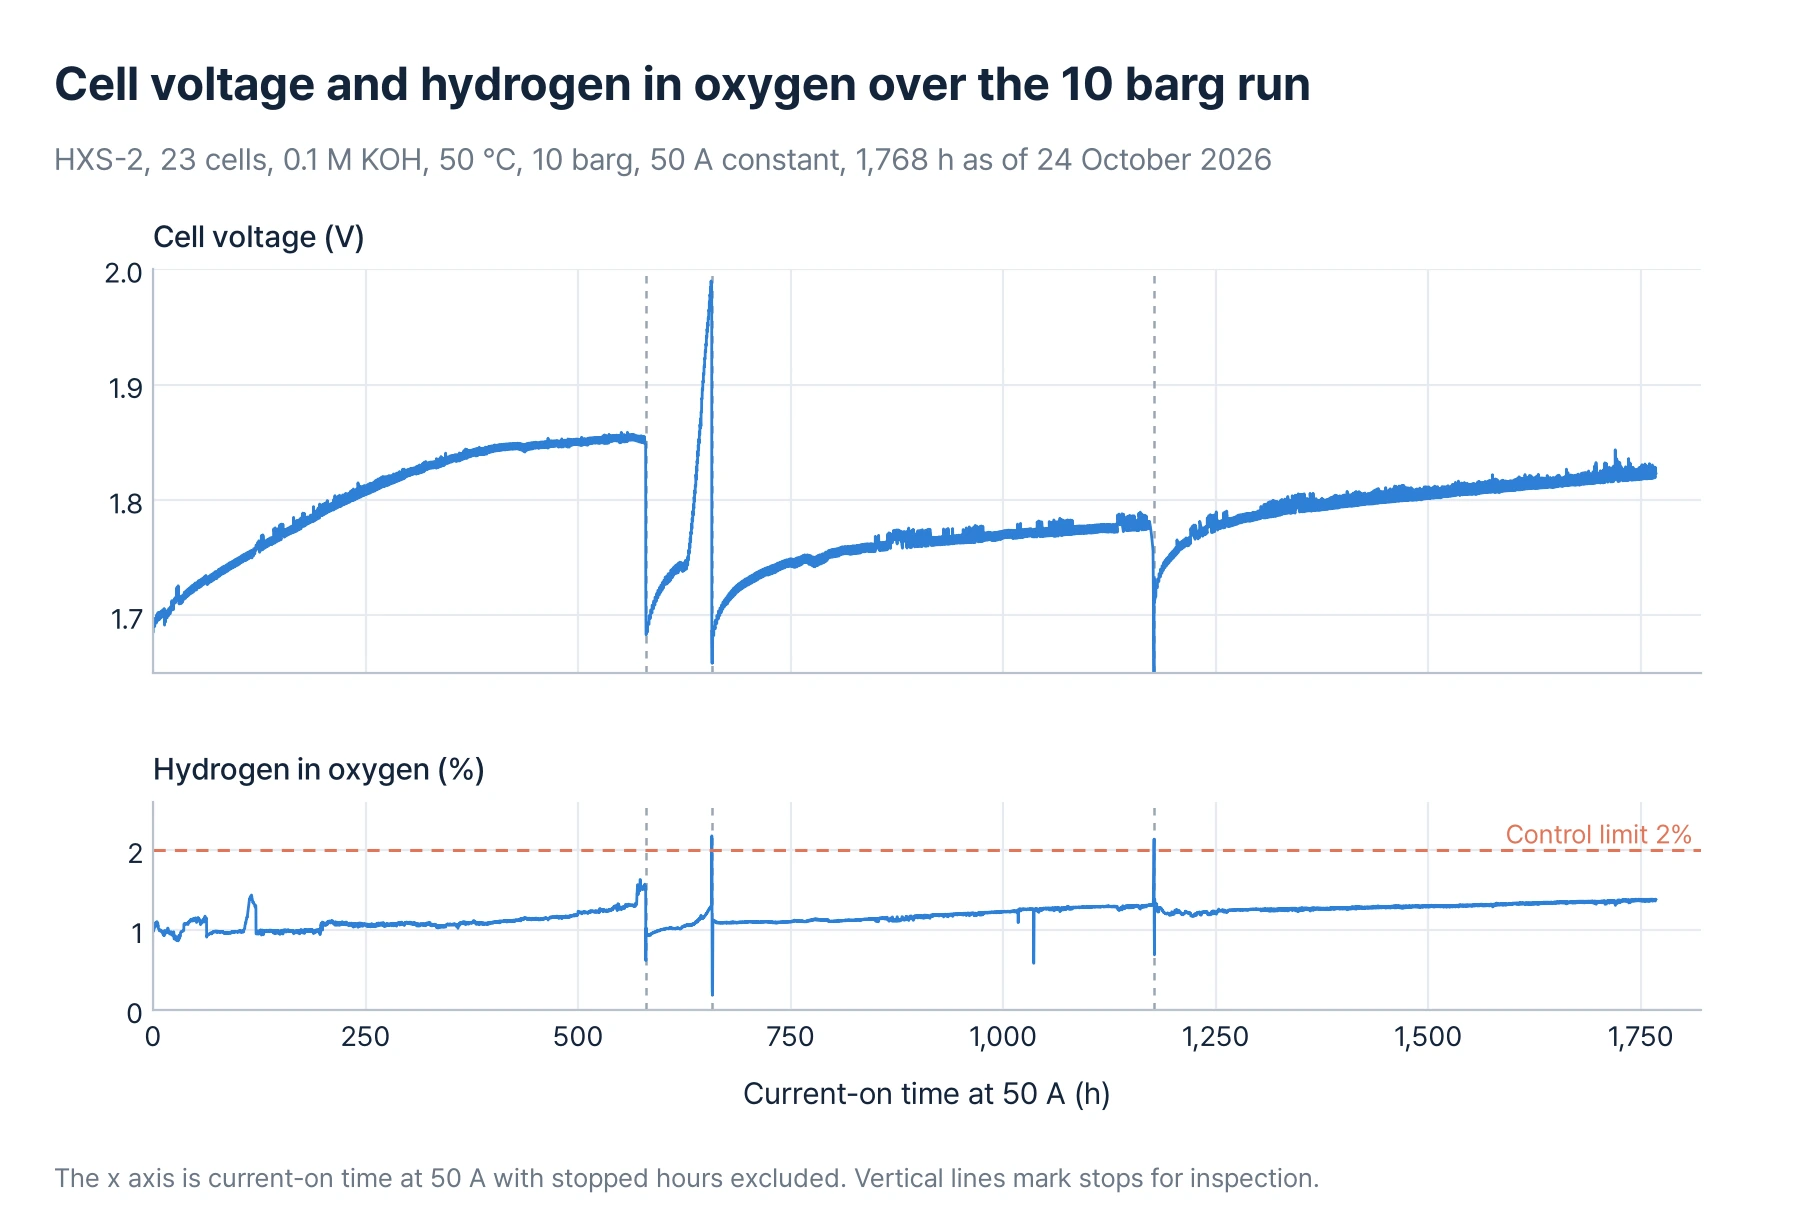
We have not converted the voltage rise into a degradation rate. The run was stopped for inspection along the way, so it is not one continuous curve, and the early fast-rising part is still mixed in. On our ambient long-term run the slope took about 1,200 hours to settle. Once enough hours have built up since the last restart, we will calculate a rate from that period and publish it.
Hydrogen in oxygen is creeping up but is below our 2% control limit. If you compare this with our 3,000-hour cumulative record, note that the ambient run used 0.3 M KOH at 40 °C.
- More than 3,000 hours on an electrolyzer stack→The ambient record at 0.3 M KOH and 40 °C.
What to check when evaluating pressurised operation
| Item | Reason |
|---|---|
| The outlet pressure you actually need | Above 3 barg the increase in crossover grows |
| Voltage difference over your operating current range | At part load the percentage is larger than at the rated point |
| Crossover measured by pressure | A single point at rated pressure does not show the operating range |
| Hours and conditions of a pressurised long-term run | An ambient durability record cannot be carried over to pressure |
In short, the voltage cost of 10 barg is small, about 30 mV per cell. Crossover is what needs attention, and above 3 barg it grows faster, so set the outlet pressure to what the application needs. Crossover between 6 and 10 barg and the long-term degradation rate under pressure are still being confirmed.
- Do you need a compressor?→What pressurised output covers, and where compression starts again.
- Running an electrolyzer on solar→How far the load can drop, and why.
- What changes when you run the stack at 10 bar→The technical note behind these figures.
- HXB-V1 system→0, 10 or 35 barg, chosen when ordering.
Frequently asked questions
How much more power does running at 10 barg take?
About 26 to 31 mV more per cell at the same current: 1.7% at rated 50 A and 1.8% at 20 A relative to ambient. Stack DC power rises by that percentage at the same current. Energy per kilogram of recovered hydrogen also depends on crossover losses and auxiliary power.
Does raising pressure reduce hydrogen output?
Output is set by current, so at constant current it stays almost the same. More hydrogen does cross to the oxygen side and is not recovered; in our measurements at 6 barg and rated load that was about 0.5% of production.
Can I estimate 10 barg crossover from the 6 barg figures?
We would not. Nothing above 6 barg was measured in this test and values differ from stack to stack. Ask for figures measured at 10 barg.
Were all the tests run on the same stack?
Two stacks. The voltage comparison and the 10 barg long-term run used the same HXS-2 23-cell stack; the crossover measurements used a different one. So we do not read the long-term crossover value as an extension of the pressure table.
Can I get the raw data?
Yes, on request: voltage and current logs, gas concentration logs and the operating conditions.
Looking at AEM for a specific application?