Our commercial 2 kW stack is 23 cells of 79 cm². The 30 kW HXS-30 is 46 cells of 512 cm². The large-area cell started well behind the 2 kW stack, and once the cause was found it came back onto the 2 kW curve at five cells and again at fifteen. In the first 15-cell run on 26 August 2026 the cell voltage was 1.660 V and the spread across all fifteen cells was 40 mV.
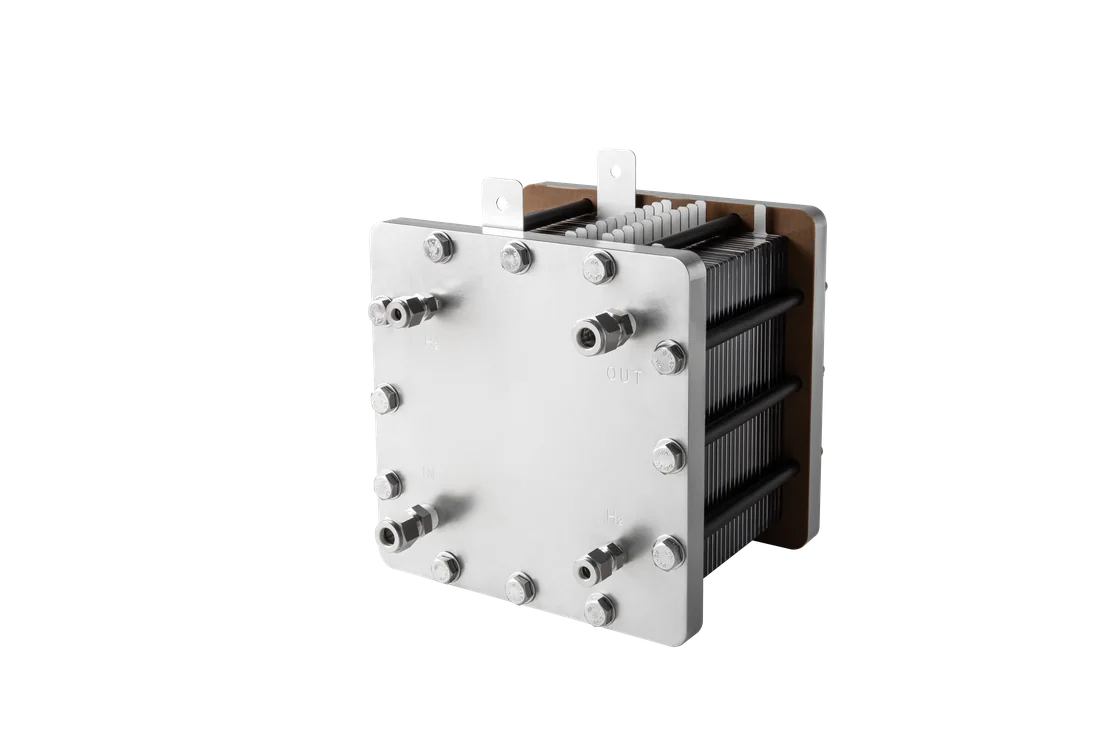
The stack HydroXpand sells today is the 2 kW HXS-2: 23 cells of 79 cm², now in service in ten countries. The next product, the 30 kW HXS-30, is 46 cells of 512 cm².
Two things change between them. The cell area grows 6.5-fold and the cell count doubles. Adding cells is a problem of assembly and uniformity, so you know in advance where the difficulty will be. Growing the area changes what happens inside the cell, and that you cannot know until you run it: how evenly current spreads over a wide face, whether electrolyte reaches the corners, whether bubbles get out.
This note is the record of going along those two axes in turn. It puts the 2 kW stack down as a reference line and sets out what was measured from the large-area single cell through five cells to fifteen, including the parts that did not go well.
The area came first, and the area was the harder of the two.
1. The reference: the 2 kW HXS-2, 23 cells of 79 cm²
Whether a new stack is any good only shows when it is laid over the stack you already sell. In 0.1 M KOH at 50 °C and ambient pressure the HXS-2 needs 1.645 V per cell at 0.633 A/cm² (50 A), a voltage efficiency of 90.0 %.
Its durability has been published separately: 2,281 cumulative hours of galvanostatic operation in 0.3 M KOH at 40 °C, with a cell degradation rate of 80.2 µV/h. This note does not revisit that data. The HXS-2 has one job here, which is to mark where the large-area cell has to get to.
2. The large-area single cell, August 2025: the first result was poor
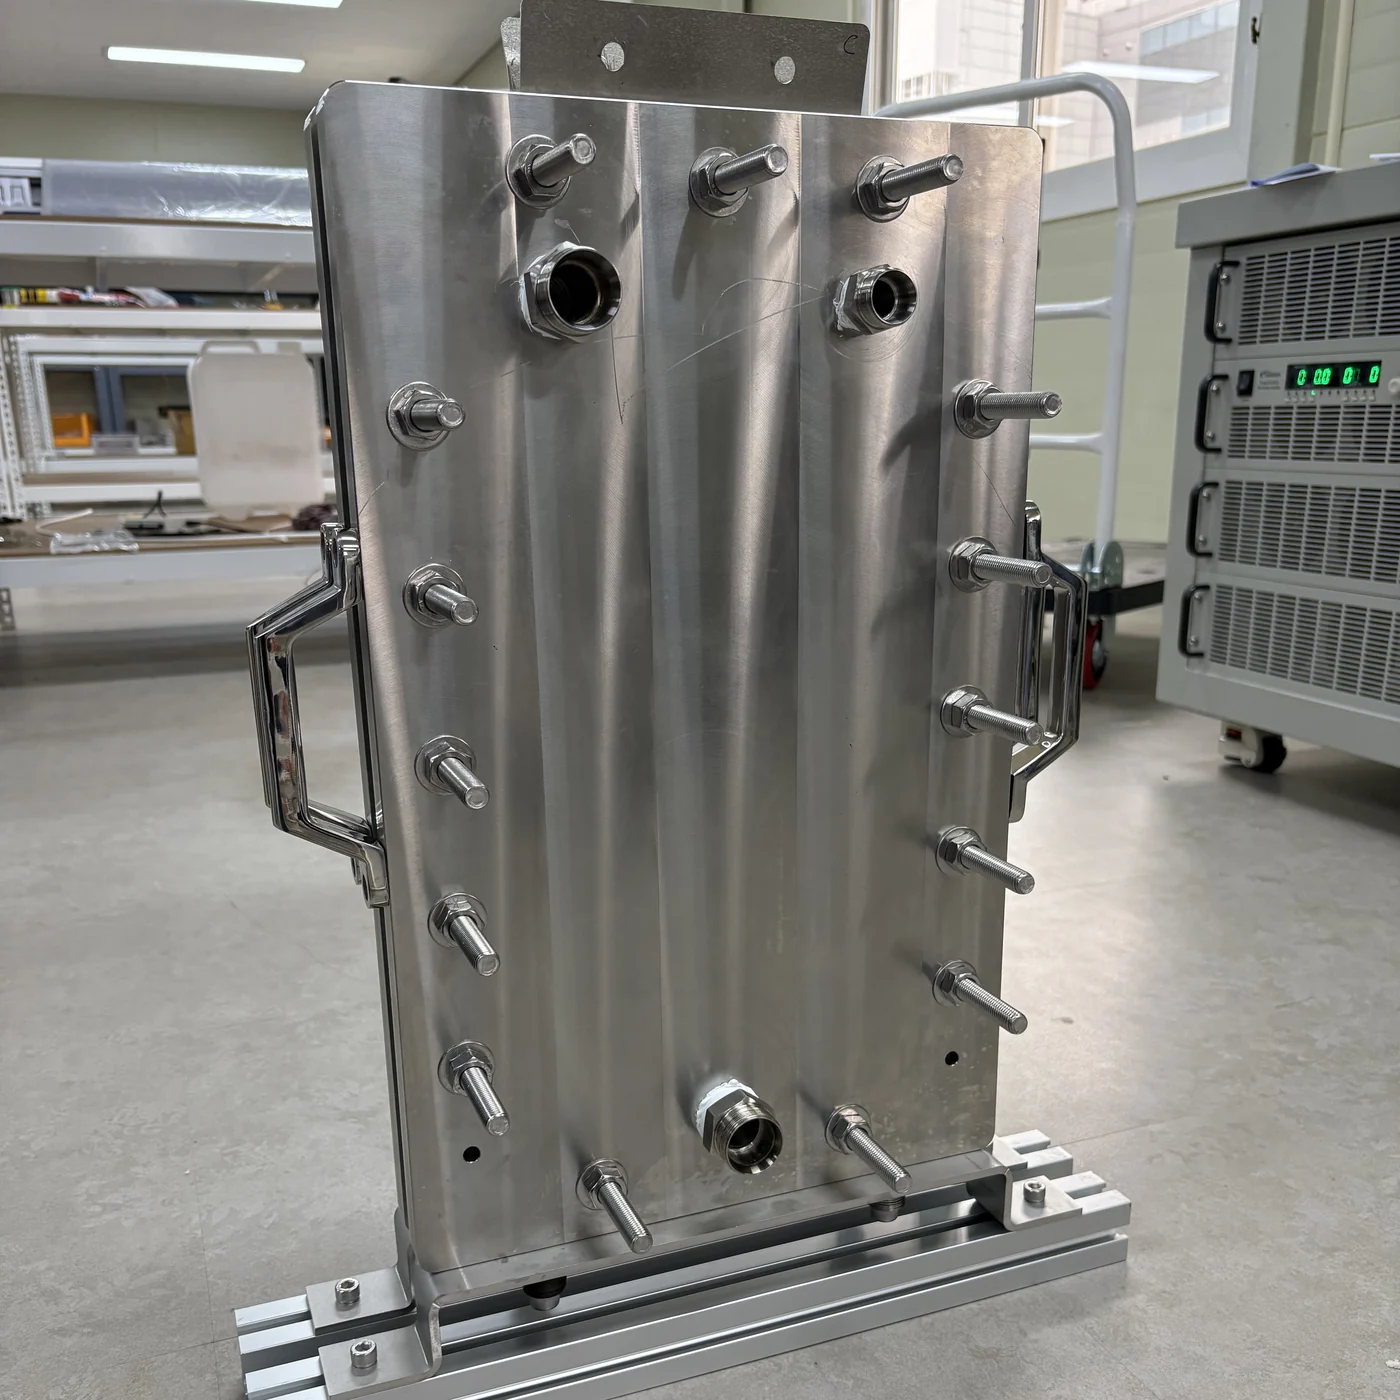
The first run of a 512 cm² cell was disappointing. At 0.64 A/cm² it needed 1.925 V, a voltage efficiency of 76.9 %, well behind a stack of twenty-three 79 cm² cells that was already in commercial service.
If catalyst activity were the problem, the electrode would have to be remade. If resistance were the problem, only the cell hardware needed adjusting. The two lead to completely different work, so the first job was to tell them apart, which the curve shape and the impedance together do.
The ohmic resistance was 0.4 Ω·cm² against 0.23 Ω·cm² for the 2 kW stack, a gap of 0.17 Ω·cm². Multiplied by 0.64 A/cm² that is 109 mV, which accounts for much of the difference. The cause was electrical contact inside the cell. As the area grows, uniform compression and contact are what decide the resistance. The electrode did not need remaking; the mechanical design did.
When the first data is bad, work out which loss produced it before reading anything into the value.
3. Five cells, June 2026: checking that the fix was right
After improving the mechanical design, we ran a five-cell short stack. At 360 A it needed 1.634 V per cell, a voltage efficiency of 90.6 %, well down from the 1.925 V of the single cell. The diagnosis had been right.
That sits below the 2 kW curve. A cell 6.5 times the area had caught up with the small-area commercial cell.
Measured cell by cell, though, the five sat between 1.615 V and 1.630 V, a spread of 15 mV. Five cells are an easy number to keep even. That result on its own does not tell you the stack is uniform.
4. Fifteen cells, 26 August 2026: 1.660 V per cell at 360 A
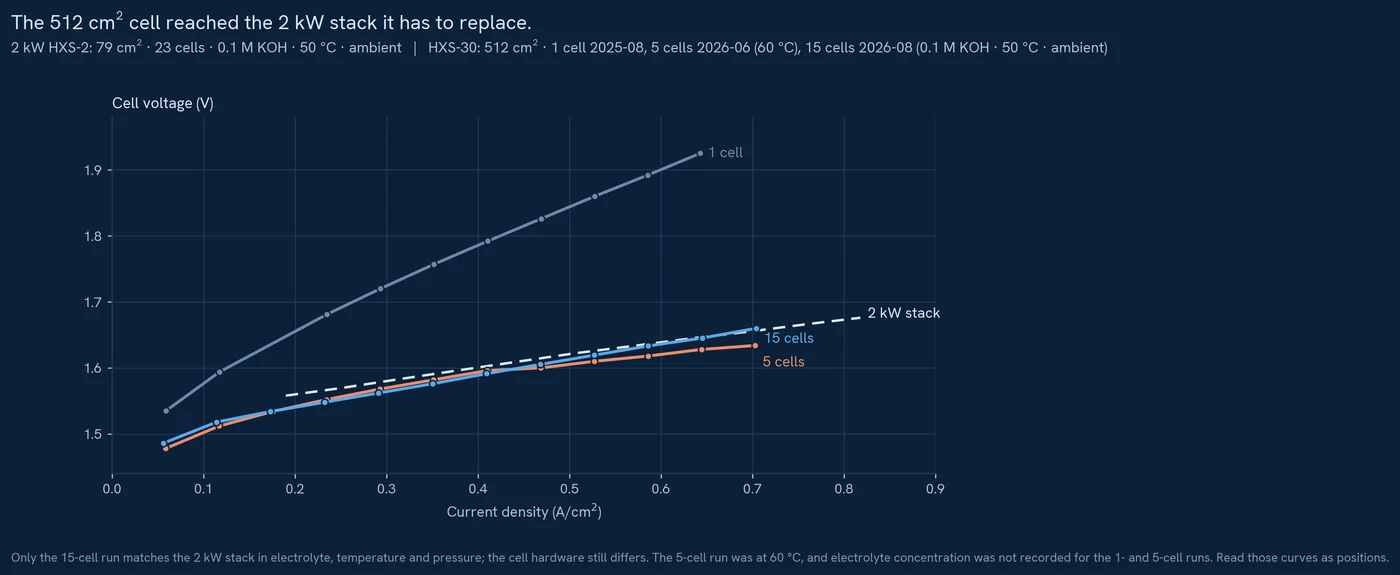
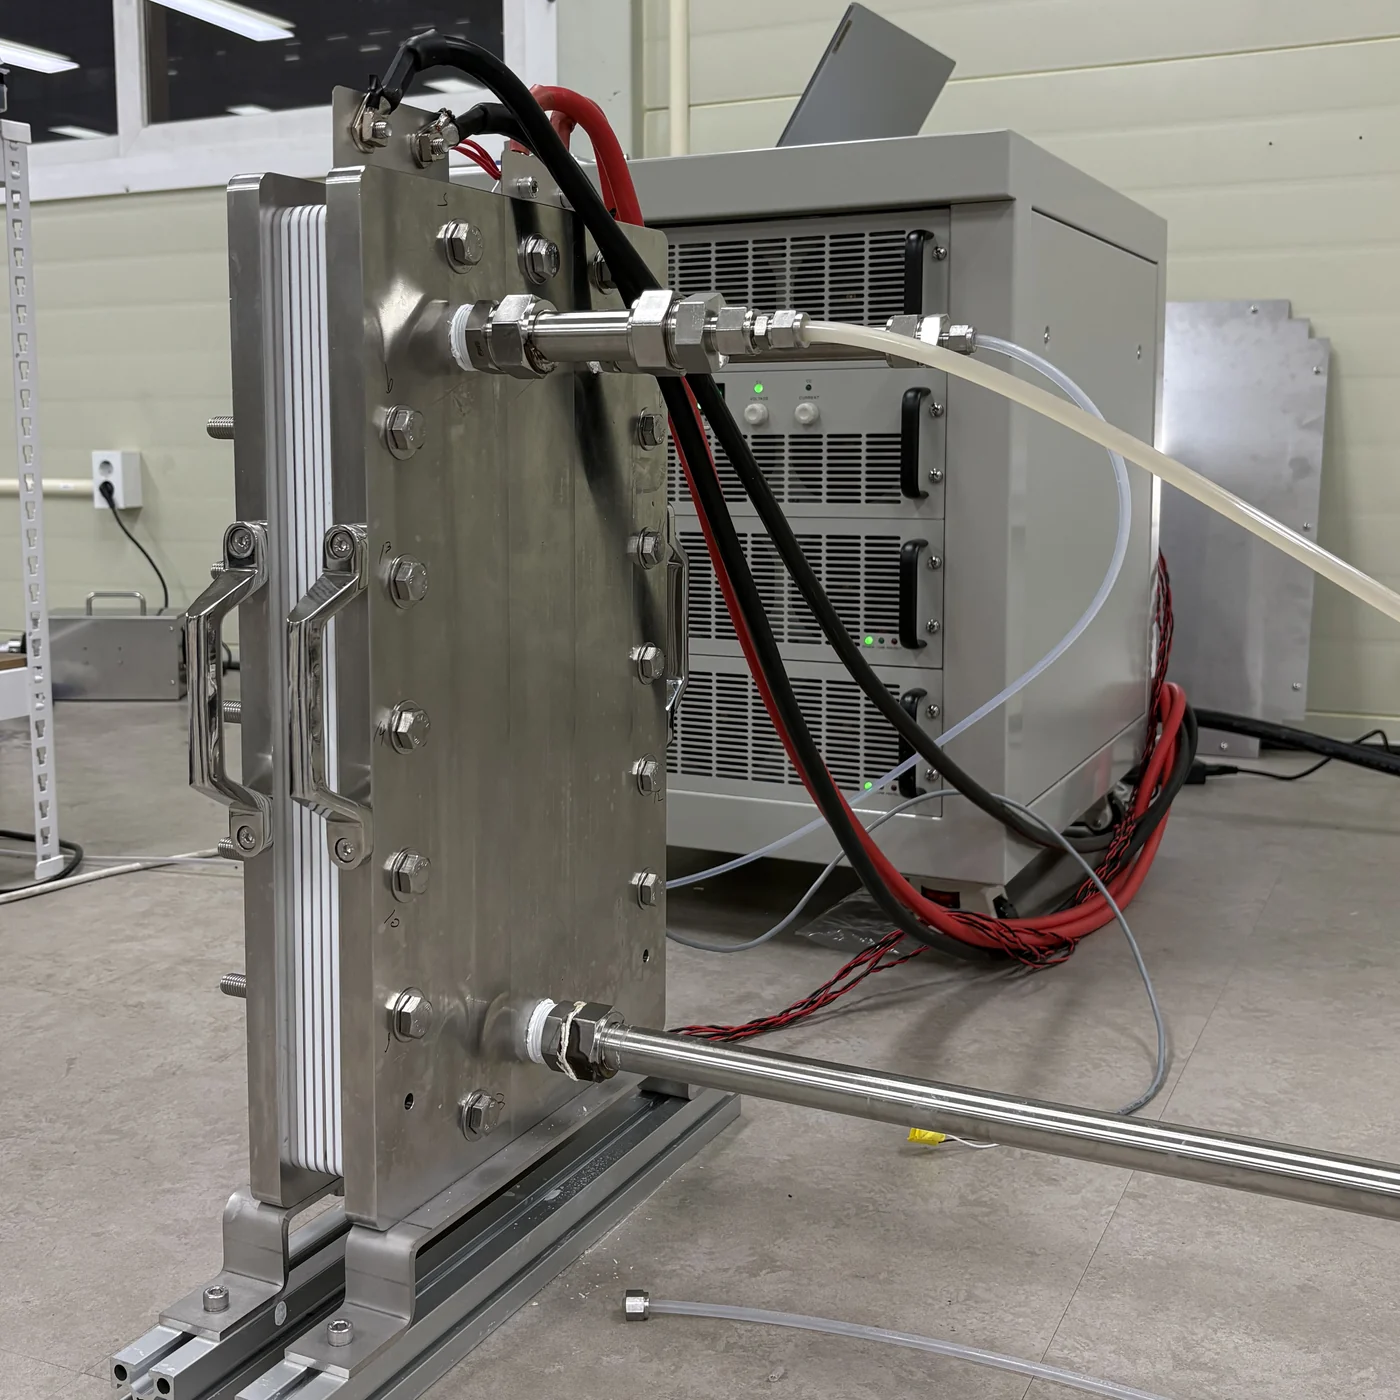
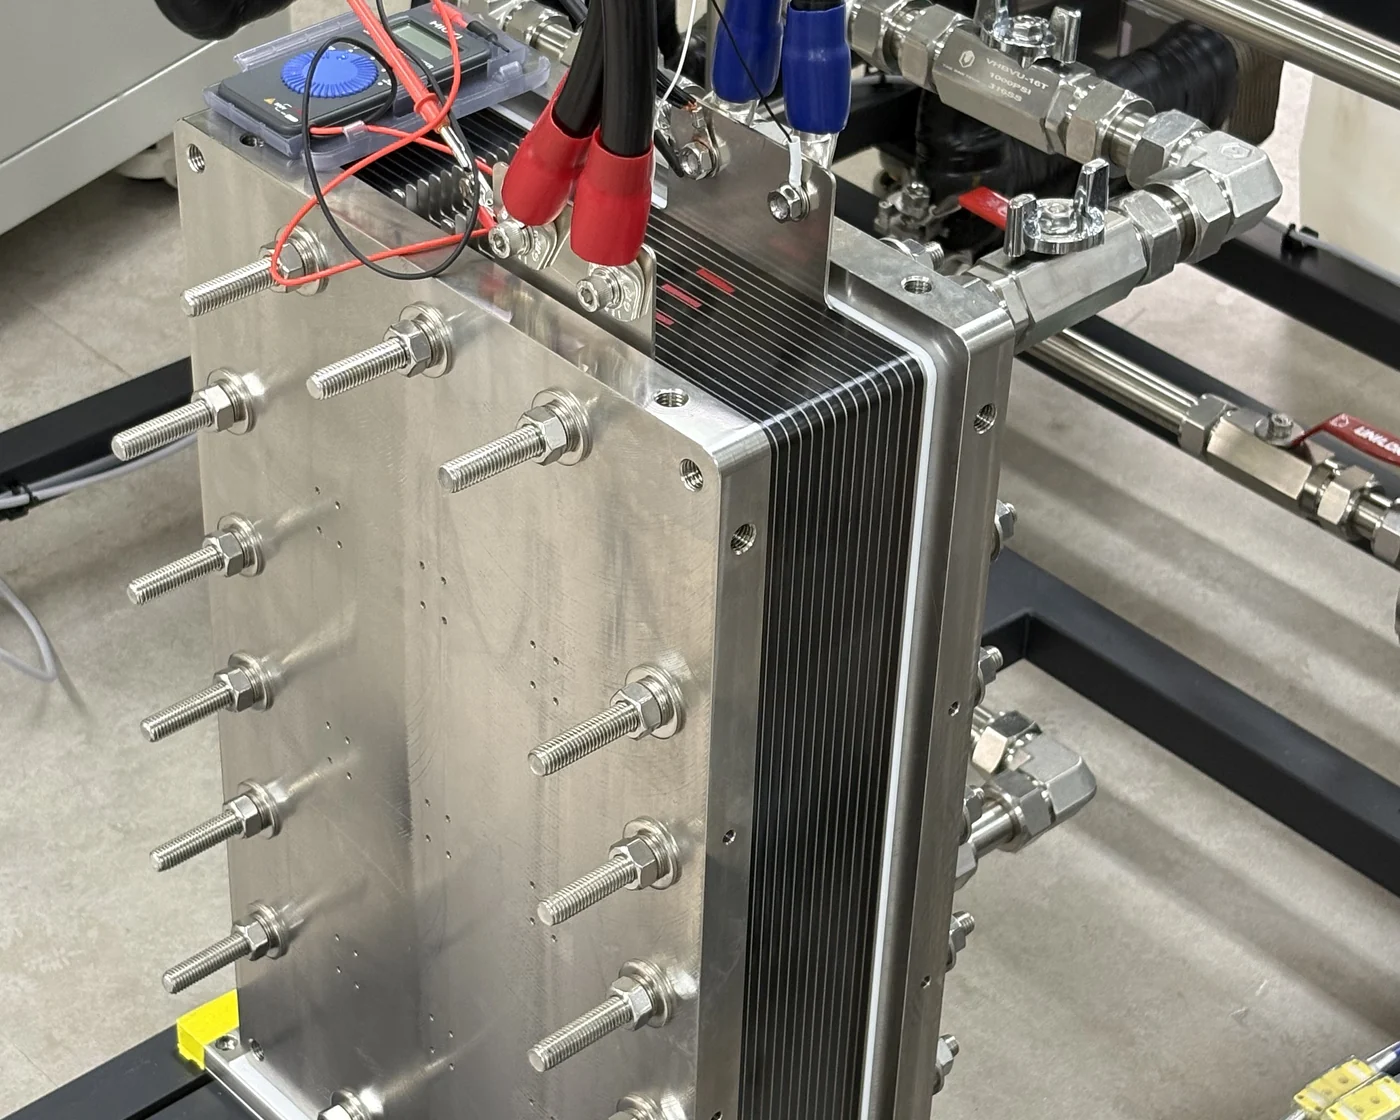
We tripled the cell count and ran the 15-cell short stack for the first time on 26 August. At 360.6 A the stack drew 24.90 V, or 1.660 V per cell, at a current density of 0.704 A/cm² on the 512 cm² cathode.
It almost overlaps the five-cell curve. Tripling the cell count left the performance of a single cell unchanged. Placed against the 2 kW stack at the same 0.1 M KOH, 50 °C and ambient pressure, the HXS-30 is at 1.645 V at 0.645 A/cm² and the 2 kW stack at 1.645 V at 0.633 A/cm²: the same cell voltage at a higher current density. At matched current density the HXS-30 is 9 to 18 mV lower between 0.23 and 0.47 A/cm², 1.4 mV lower at 0.645 A/cm² and 3.5 mV higher at 0.704 A/cm². The two curves sit almost on top of each other.
Not every run is at matched conditions. The five-cell run was at 60 °C electrolyte and this one at 50 °C, and the 26 mV per cell between them should not be read as degradation. The 15-cell run and the 2 kW stack do share 0.1 M KOH, 50 °C and ambient pressure, but the cell area and frame are different hardware. Electrolyte concentration was not recorded for the single-cell and five-cell runs, so until those are repeated at matched conditions we read their curves as positions and do not subtract them.
5. What it means that the whole range was a straight line
The twelve points fall on a single straight line. Dividing the slope by the electrode area gives an area-specific resistance of 0.25 Ω·cm²: each cell rises 0.49 mV per additional ampere, and extrapolating to zero current gives 1.486 V per cell.
In this current range resistance sets the losses. There is no curvature from the activation region and no sharp bend from a mass-transport limit. That was the part we were most worried about in a large-area cell: if electrolyte were failing to reach the far corners of a wide face, or if bubbles were not clearing, the curve would bend upward at high current. It did not.
A straight line also means there is headroom left. This run stopped at 360 A, and any reduction in that 0.25 Ω·cm² comes straight off the cell voltage at the same current.
6. A 40 mV spread across all fifteen cells
- one electrolyte stream splits among the cells, so the flow each cell receives differs
- one long tie rod compresses many cells, so face pressure differs between the middle and the ends
- cells in the middle have less path for heat to leave, so they run hotter
Which is why the number to follow as cell count rises is the cell-to-cell spread more than the average.
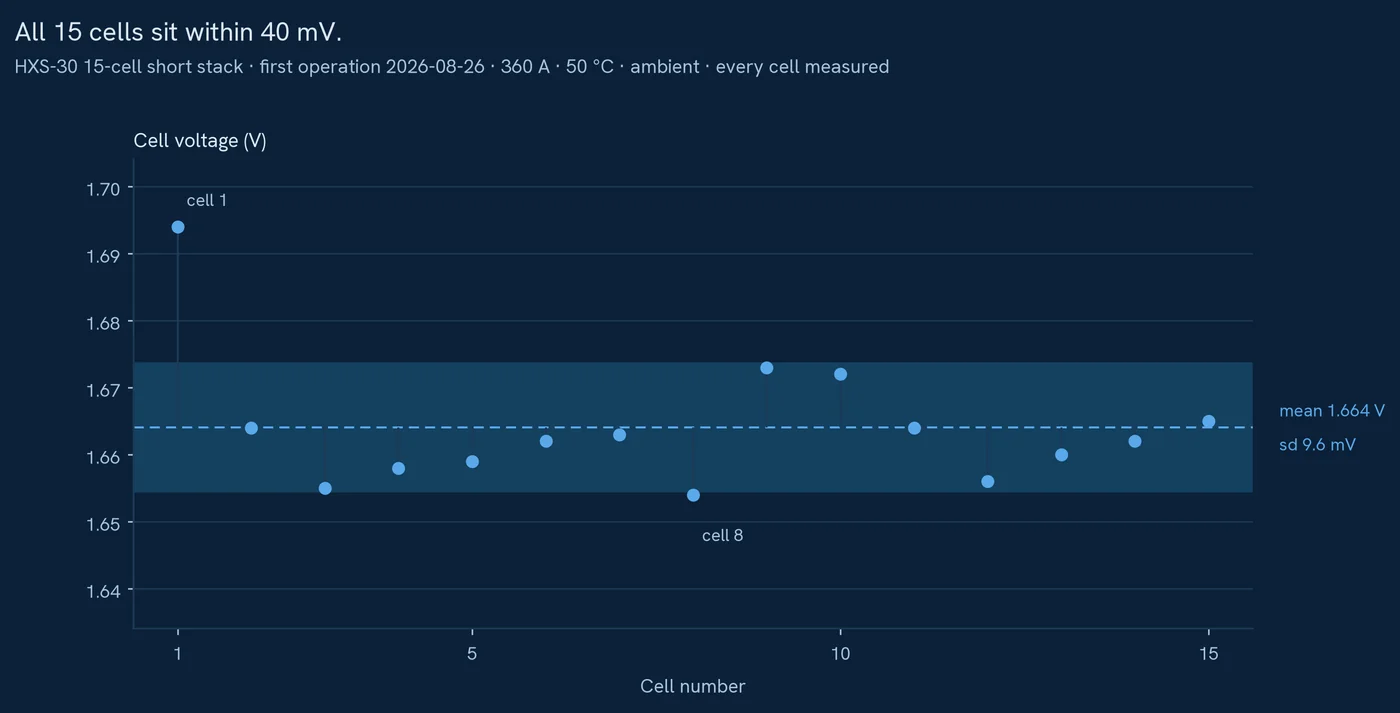
This is where the second axis, cell count, begins. We measured all fifteen cells individually. The mean was 1.664 V with a standard deviation of 9.6 mV, and the gap between the highest cell (number 1, 1.694 V) and the lowest (number 8, 1.654 V) was 40 mV. For a first build that is even, and no cell was visibly lagging or unstable.
We also checked whether to trust the reading. The fifteen cell voltages sum to 24.96 V, and the first point of the i-V sweep taken in the same minutes was 24.90 V. Two different instruments agreed.
Cell 1 is the highest. End cells running slightly high is a common pattern: cells near the end plates see different compression and different flow from the ones in the middle. That difference tends to grow with cell count.
- HXS-30 · 30 kW stack→The product this note is about. 46 cells · 600 cm² anode · 512 cm² cathode.
- HXS-2 · 2 kW stack→The commercial stack used as the reference. 23 cells · 79 cm².
- HXS-2 durability data→The HXS-2 long-run note. 80.2 µV/h per cell.
7. Next is the 46-cell full stack
The finished HXS-30 is a 46-cell stack. We build the first full stack in September 2026, tripling the cell count again.
Cell voltage was settled by the fifteen-cell run. What the 46-cell run has to answer is how the spread behaves as cell count rises.
- how far the spread across all 46 cells opens from the 40 mV measured at fifteen
- how the gap between end cells and middle cells grows with cell count
- how far the temperature in the middle of the stack separates from the ends
- whether the 15-cell and 46-cell i-V curves overlap at matched temperature
We are not going to predict 46-cell performance from the 15-cell result. Two things have been measured so far: a cell 6.5 times the area came down onto the 2 kW curve, and across a threefold increase in cell count the spread across all fifteen cells stayed inside 40 mV.
The 46-cell results will go on this page as they come.
Need the detailed durability graphs and i-V test conditions?