From a single cell through five and fifteen cells, we have reached 46-cell full-stack operation. We share the first 96.7 hours at approximately 360 A, the cell-voltage distribution and the next improvements.
Starting with a large-area single cell, we progressed through five and fifteen cells and have now operated a 46-cell full stack. HydroXpand's 30 kW-class HXS-30 has entered operation in its full cell-count configuration.
Initial testing began on 18 September. On 22 September we began the long-run record at approximately 360 A. Across the 96.7 hours analysed here—about four days—no interruption of current was observed in the records. Taking the work from a small number of cells to full-stack operation is an important milestone for our team.
We can now base the next improvements on actual operating data from all 46 cells. This note covers how we reached this point, the first long-run results and the work ahead.
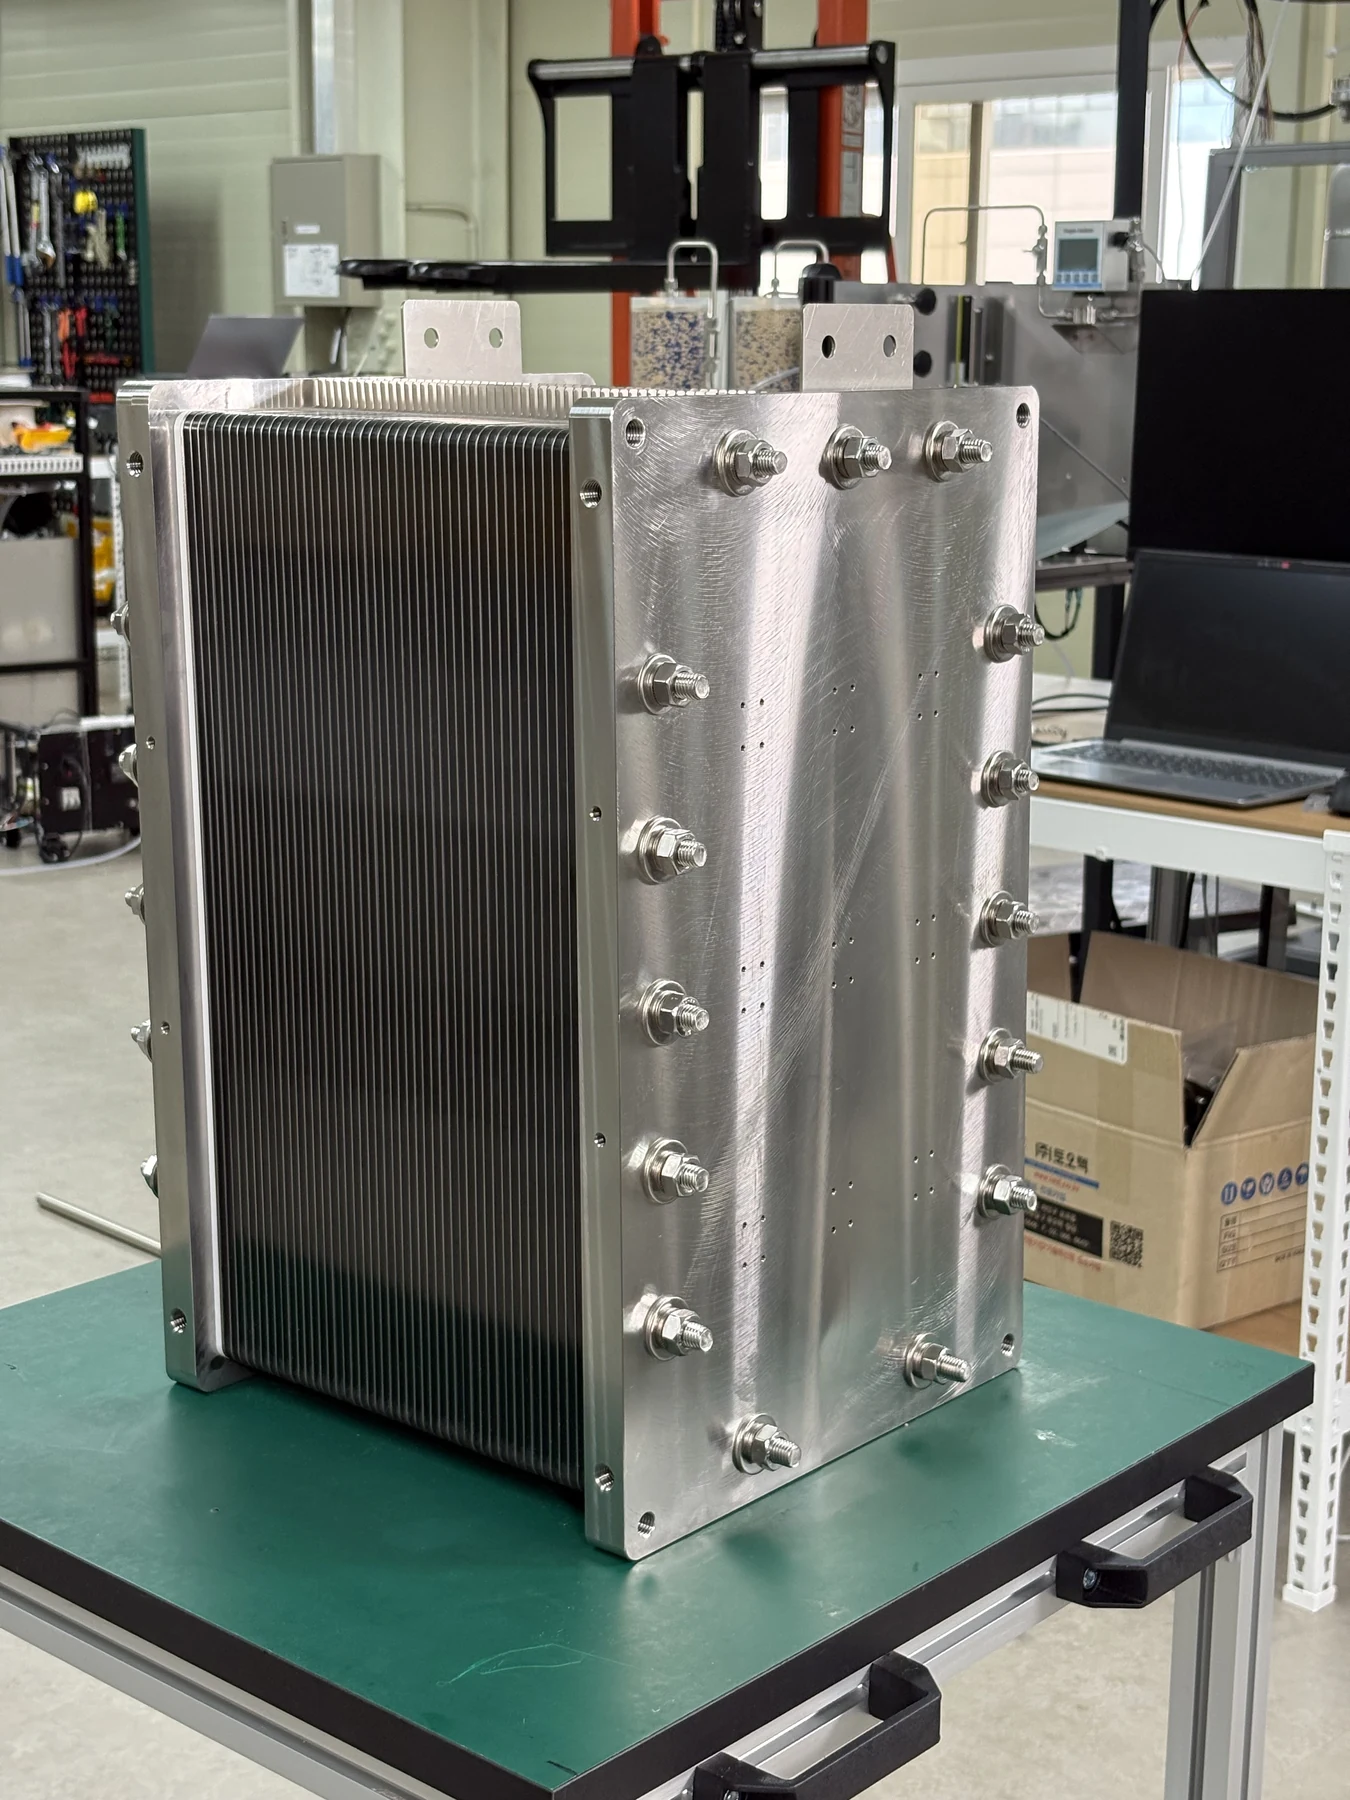
1. Development from a single cell has reached the 46-cell full stack
The first large-area cell performed worse than the 2 kW stack we were already selling. We identified contact-resistance issues, improved the mechanical design and increased the test scale to five and then fifteen cells.
Our previous technical note reported 293 hours of operation of a 15-cell short stack at 360 A. This time the stack contains 46 cells. The injection-moulded PPS cell frame also changed from V1 to V2.
The 46-cell stack was assembled on 17 September, and initial powered testing began on 18 September. It was neither disassembled nor reassembled when we switched to long-run recording on 22 September. The start of the interval in this note is the start of that record, not the stack's first power-on.
The record covers 22 September at 15:30:35 through 26 September at 16:09:59: 96.6568 hours. All times are Korea Standard Time.
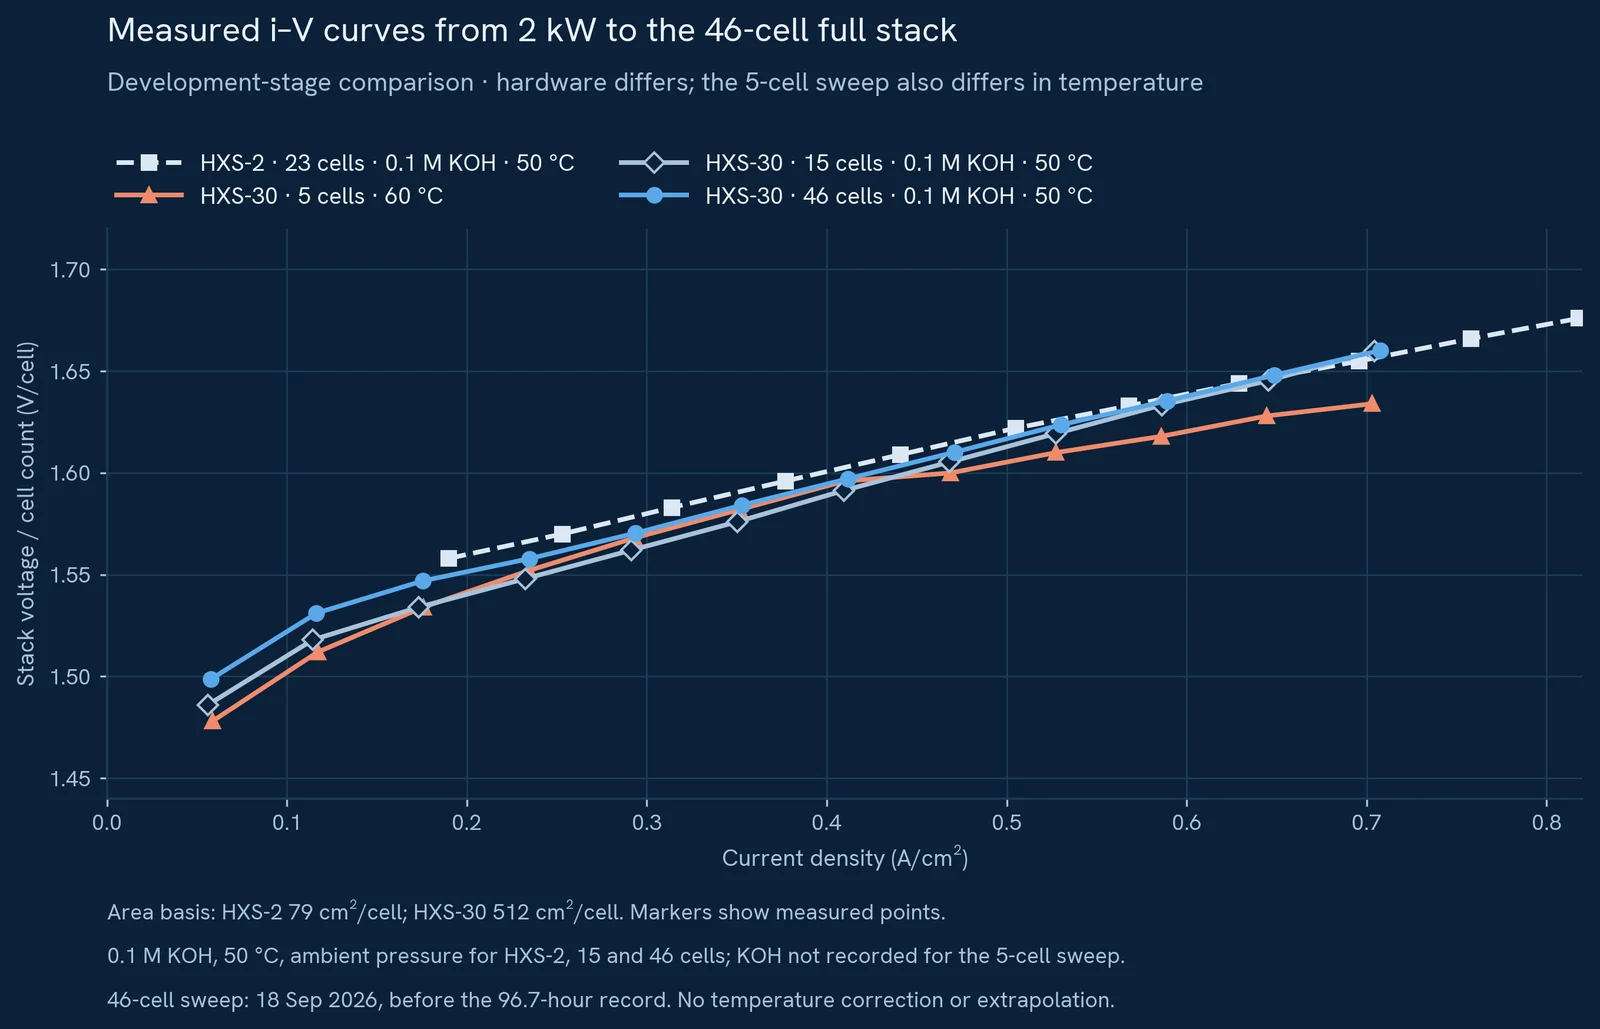
Current density uses 79 cm² for HXS-2 and 512 cm² for HXS-30. The initial 46-cell curve lies close to the 15-cell curve and within −9 to +3 mV per cell of the HXS-2 curve between 0.23 and 0.71 A/cm². However, the 5-cell sweep was at a different temperature, and HXS-2, the 15-cell and the 46-cell stacks differ in hardware such as cell area and cell frame, so the separation between curves cannot be attributed solely to cell count.
HXS-2 uses the sweep measured on 31 July 2026 at 0.1 M KOH, 50 °C and ambient pressure. The 15-cell sweep was also at 0.1 M KOH, 50 °C and ambient pressure. The 5-cell sweep was at 60 °C, and its electrolyte concentration was not recorded. The 46-cell test used 0.1 M KOH at 50 °C and ambient pressure. The short-stack curves document development history and do not replace the specifications of the current 46-cell product.
The 46-cell curve was measured during initial testing on 18 September 2026. It is a separate measurement taken before the 96.7-hour record beginning on 22 September, not a performance curve measured after that long-run interval.
2. Test conditions
| Item | This test |
|---|---|
| Stack | HXS-30, 46-cell full stack |
| Cell frame | Injection-moulded PPS V2 |
| Membrane | A50R |
| Electrodes | NiFe-based anode / PtRu/C cathode |
| Cathode active area | 512 cm² per cell |
| Electrolyte | 0.1 M KOH |
| Current setpoint | 360 A, approximately 0.70 A/cm² based on cathode area |
| Measured current range | 359.1–361.7 A |
| Temperature | 50 °C setpoint; measured stack inlet 48.0–50.8 °C |
| Analysed record | 261,456 rows, each containing all 46 cell voltages |
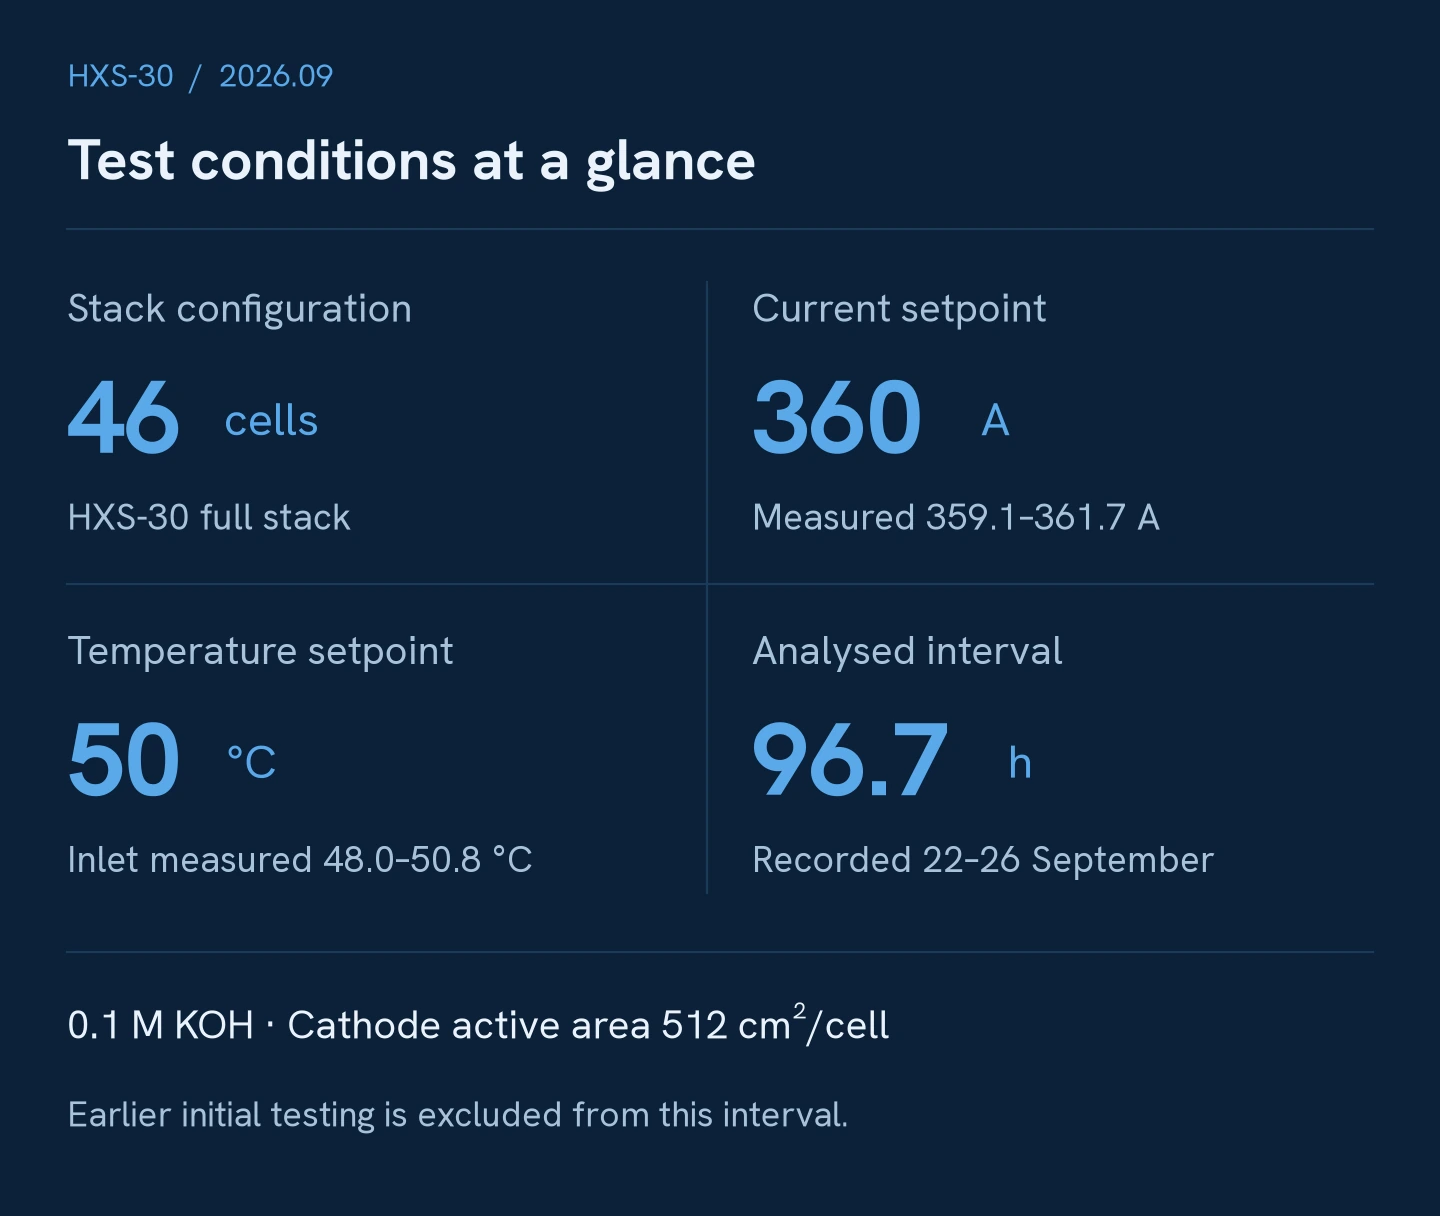
Electrolyte concentration and stack configuration are based on the researcher-confirmed record. The 50 °C value is a setpoint. The time-weighted mean measured inlet temperature was approximately 50.0 °C; the outlet mean was approximately 51.0 °C.
Multiplying measured current by stack voltage gives a stack electrical input of 27.53–29.13 kW. This excludes power-supply losses and the consumption of auxiliaries such as pumps and chillers.
3. We assembled 46 cells and sustained about four days of operation
After assembling the 46 cells and applying current for the first time, we obtained about four days of long-run records. With more than three times the cell count of the previous 15-cell stack, the full stack continued operating at approximately 360 A. The time-weighted mean electrolyte inlet temperature was 50.0 °C. The full stack and its circulation and cooling equipment operated together.
No row in the record shows a current of 5 A or below. The longest interval between records was 13.737 seconds. We can therefore say that no interruption of current was observed in these records, although brief interruptions shorter than the recording interval cannot be ruled out.
The 96.7 hours count only the long-run interval beginning on 22 September. Earlier initial testing is not included.
4. Voltage and cell-by-cell distribution in the full stack
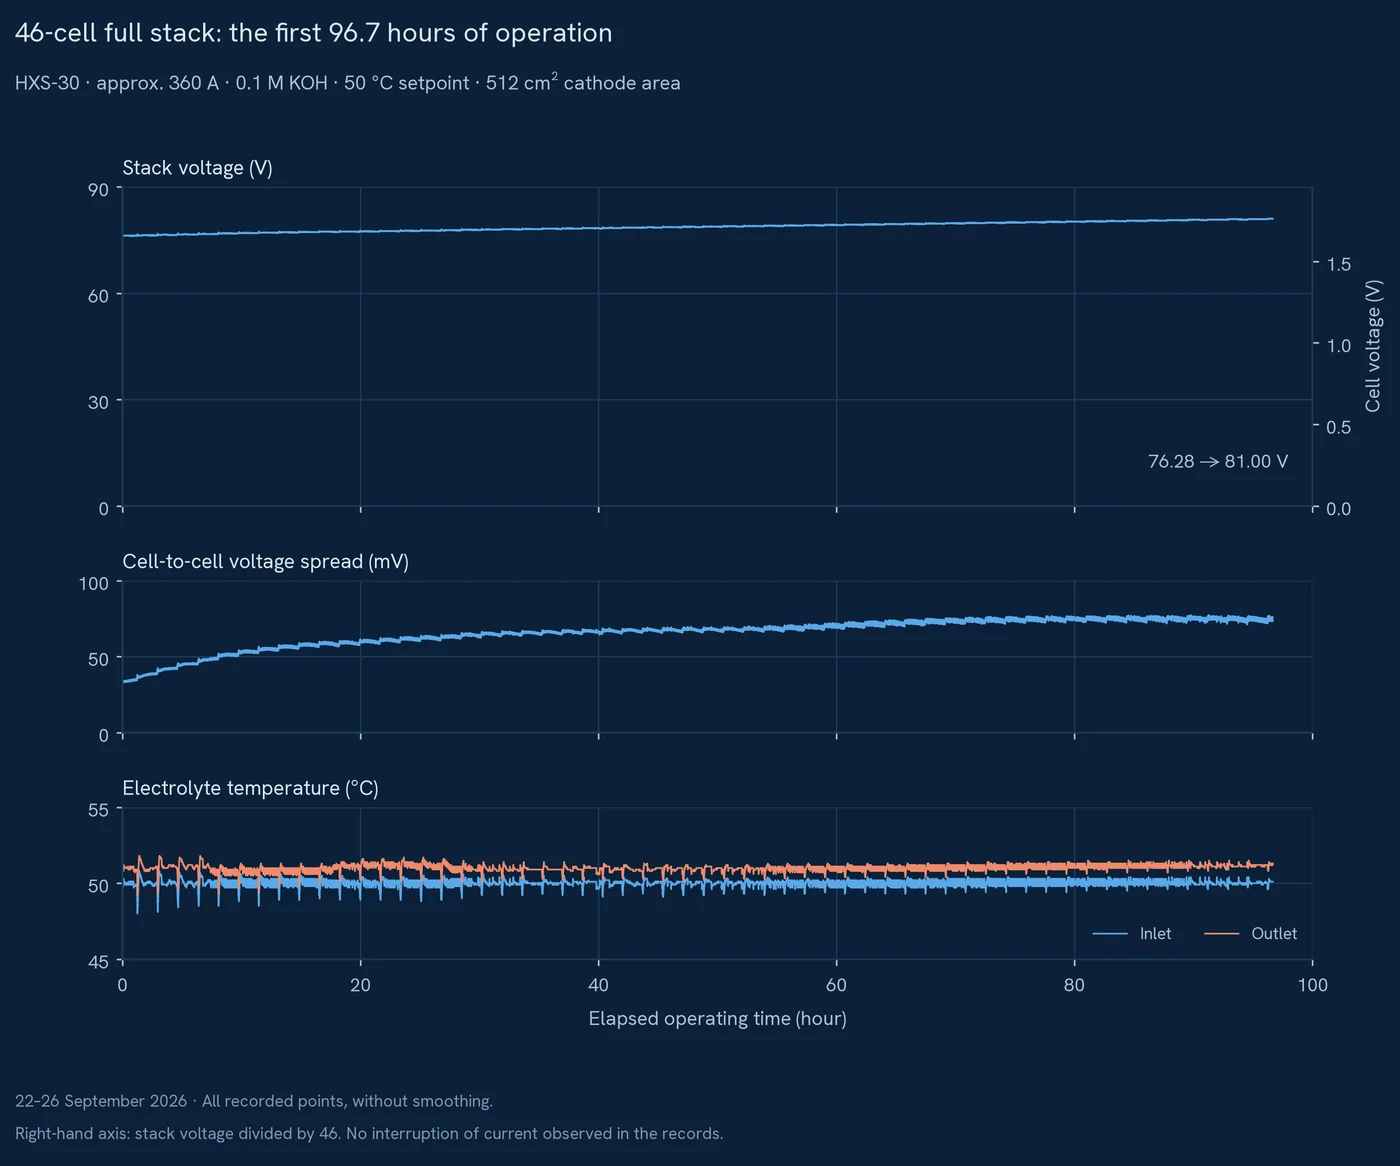
Stack voltage was 76.28 V at the start of the record and 81.00 V at the end. Dividing by 46 gives 1.658 → 1.761 V per cell, an increase of approximately 103 mV per cell between the two endpoints.
Individual cell voltages reveal a further change. The maximum-minus-minimum spread across the 46 cells increased from 33.7 mV at the start to 74.3 mV at the end. The largest spread anywhere in the interval was 77.4 mV.
| Metric | Start of record | End of record |
|---|---|---|
| Stack voltage | 76.28 V | 81.00 V |
| Stack voltage ÷ 46 | 1.658 V/cell | 1.761 V/cell |
| Lowest individual cell voltage | 1.6379 V | 1.7122 V |
| Highest individual cell voltage | 1.6716 V | 1.7865 V |
| Maximum-minus-minimum cell voltage | 33.7 mV | 74.3 mV |
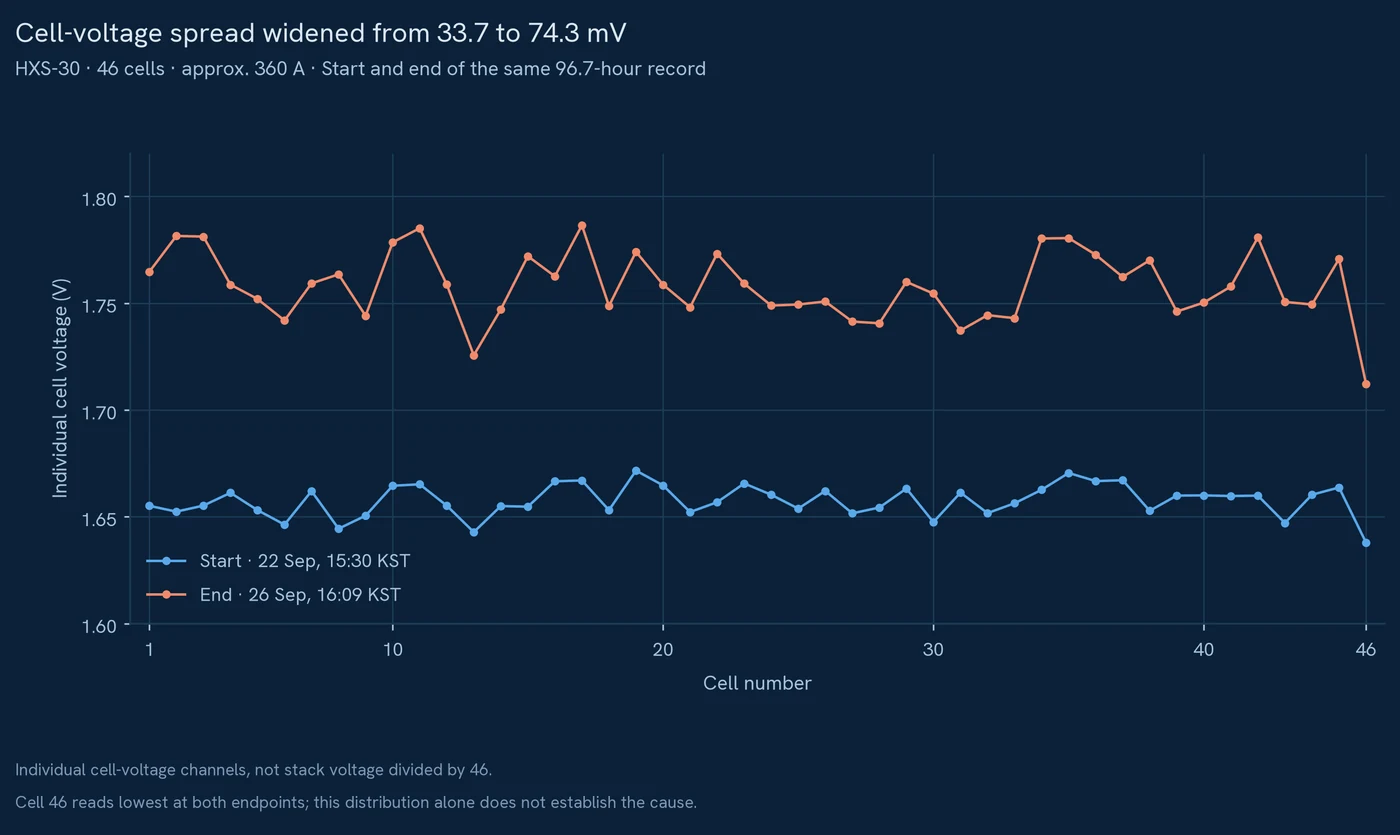
All 46 cell-voltage channels recorded values throughout the interval. The cell-to-cell spread did not remain at its initial level: the distribution widened as average voltage increased. Both changes need to be tracked.
Stack voltage and individual cell voltages come from separate measurement channels. The table's stack-voltage-divided-by-46 value is not treated as identical to the arithmetic mean of the individually measured cell voltages.
5. The next improvement focuses on the rate of voltage rise
A single linear fit to stack voltage divided by 46 over the complete 96.7-hour record gives a rise of approximately 1,027 µV/h per cell. To check the effect of unequal sample intervals, the same calculation was applied to five-minute averages, giving a similar result of approximately 1,022 µV/h per cell.
The previous 15-cell note reported 540 µV/h per cell over its complete 293-hour interval. The slope in this initial full-stack interval is higher. However, test duration and cell frames differ, so the difference cannot be attributed solely to the increase in cell count.
This is the voltage-rise rate observed during the initial 96.7 hours. Longer records and root-cause analysis are required before establishing a long-term degradation rate or predicting lifetime. The current data cannot separate the contributions of initial stabilisation and continuing performance loss.
Gas-analysis channels were also recorded. The hydrogen-in-oxygen channel showed 0.21–0.23%, and the oxygen-in-hydrogen channel ended at 407.6 ppm. However, analyser calibration and reading-update status were not verified in these materials. The oxygen-in-hydrogen channel also remained at 1,000 ppm for part of the interval; whether this is the measurement ceiling requires confirmation. These records alone do not establish gas purity or quality compliance.
6. Full-stack operation is the starting point for longer runs
Since the first large-area cell fell short of expectations, we have improved the design step by step and increased the cell count. That work has now led to operation of the 46-cell full stack. Our team has reached the point of assembling a 30 kW-class full stack and obtaining about four days of operating records.
The achievement also makes the next improvements concrete. We need to determine whether the rate of voltage rise changes with time, whether the cell-to-cell spread widens further, and whether another test under the same conditions reproduces the results. These are initial operating records from one stack; long-term durability validation must continue.
We have progressed from a single cell to 46 cells. The next goal is to operate this full stack for longer and at lower voltage.
Analysis cutoff: long-run database records extracted through 26 September 2026 at 16:09:59 KST. Later live snapshots are not mixed into the figures in this note. Time-weighted means were calculated by integrating linearly between adjacent measurements.
Need the detailed durability graphs and i-V test conditions?