Solar is among the cheapest ways to make new electricity, and it makes nothing at night. This article sets out four advantages and four limits of solar energy with the numbers behind each, from IRENA's 2024 cost data to Korea's 14–16% capacity factor, and uses ten years of sunlight data for Daejeon to work out what a 3 kW roof and a 1 MW plant produce through the year, and how much hydrogen that electricity can make.

Solar power needs no fuel and has become one of the cheapest sources of new electricity, but it only produces while the sun is up, and in Korea a fixed array delivers the equivalent of 14 to 16% of a year at full output. The advantages come from cost and installation; the limits come from time and place.
We make electrolyzers, which turn electricity into hydrogen, so we look at solar both as a power source and as the raw material for green hydrogen. That view only enters in the last section; the eight points are the same for anyone.
How solar power works
A solar panel is a set of semiconductor solar cells wired together. When light reaches a cell, electrons in the semiconductor move, and that flow through the circuit is the electricity. This is the photovoltaic effect: light turns into electricity directly, with no combustion and no turbine.
Panels produce direct current. Homes, factories and the grid need alternating current, so an inverter sits in between. Equipment that runs on DC, such as electrolyzers and batteries, can skip part of that conversion.
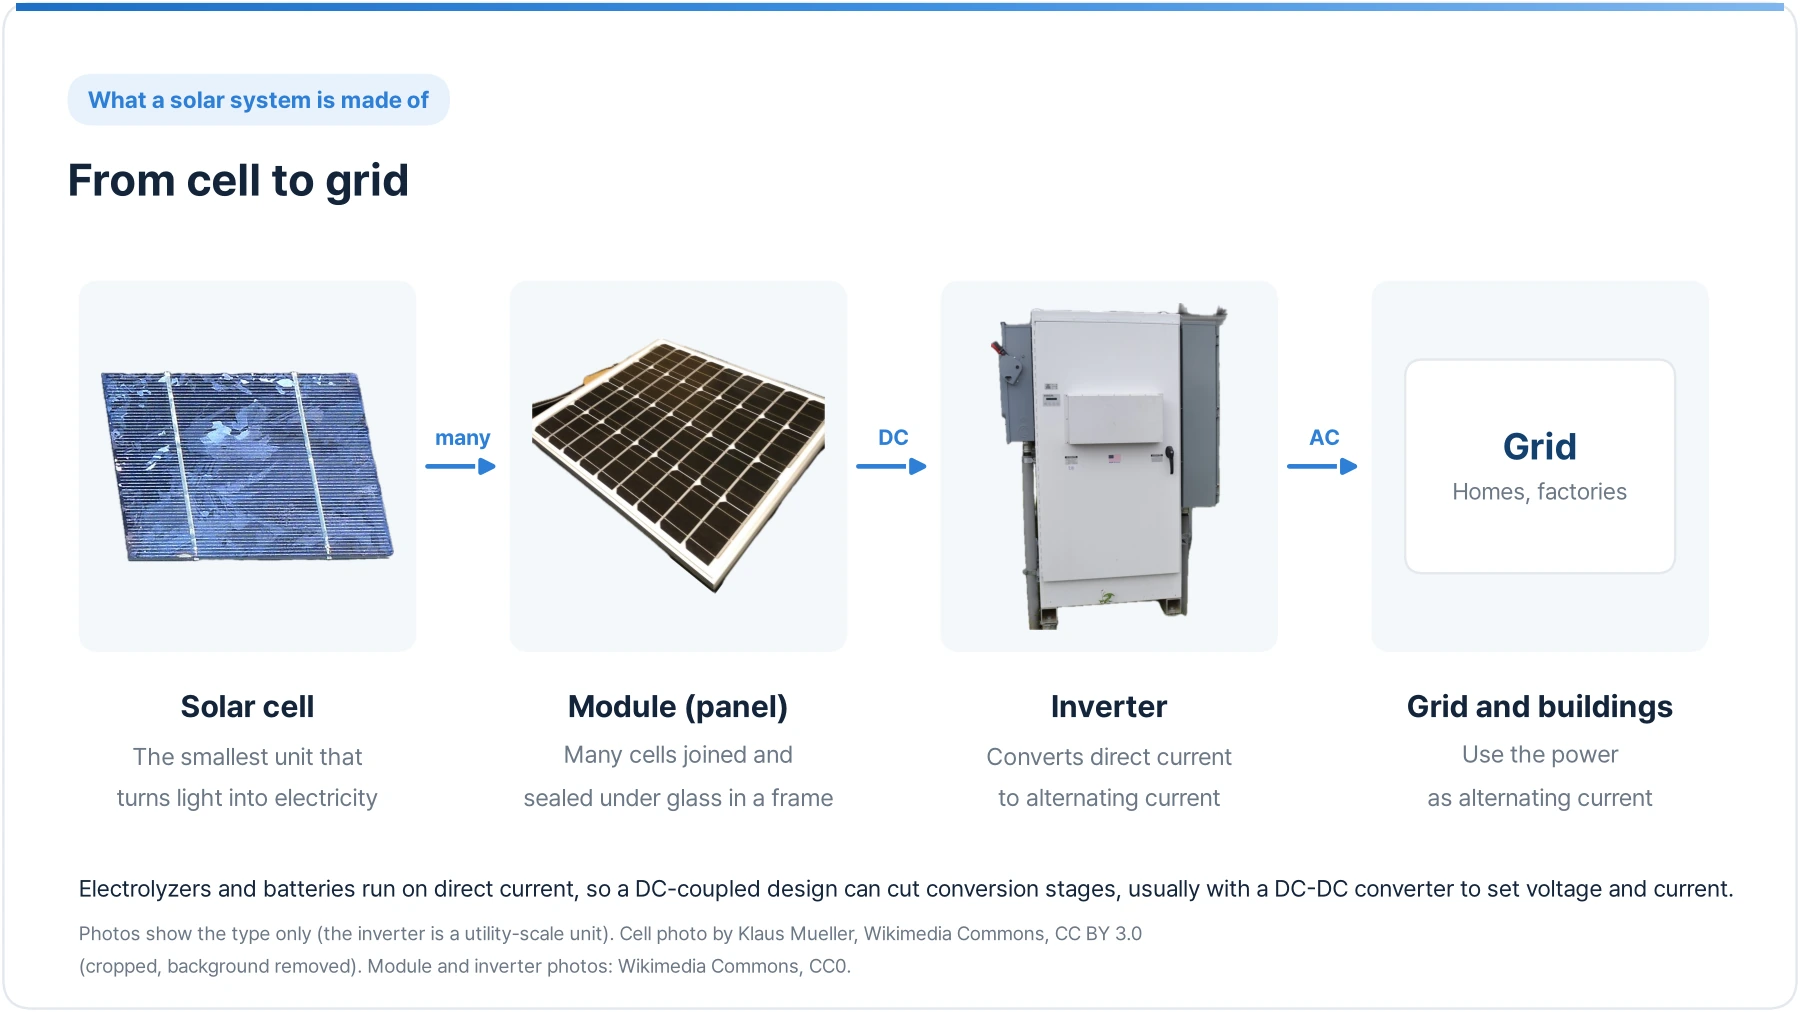
Module efficiency is the share of incoming light energy a panel turns into electricity. Commercial monocrystalline silicon module efficiency has risen from about 17% to just under 25% over the past ten years, according to Fraunhofer ISE. Panels are rated at standard test conditions: 1,000 W/m² irradiance, 25 °C cell temperature and the standard AM1.5 solar spectrum. At those conditions a 22% efficient module is rated at about 220 W per square metre of module area. A plant's site is larger, because it includes the spacing between rows.
SourcesCell photo: Klaus Mueller, Wikimedia Commons, CC BY 3.0 (cropped, background removed). Module and inverter photos: Wikimedia Commons, CC0 · Creative Commons Attribution 3.0 licence · Fraunhofer ISE, Photovoltaics Report: commercial silicon module efficiency over the past decade

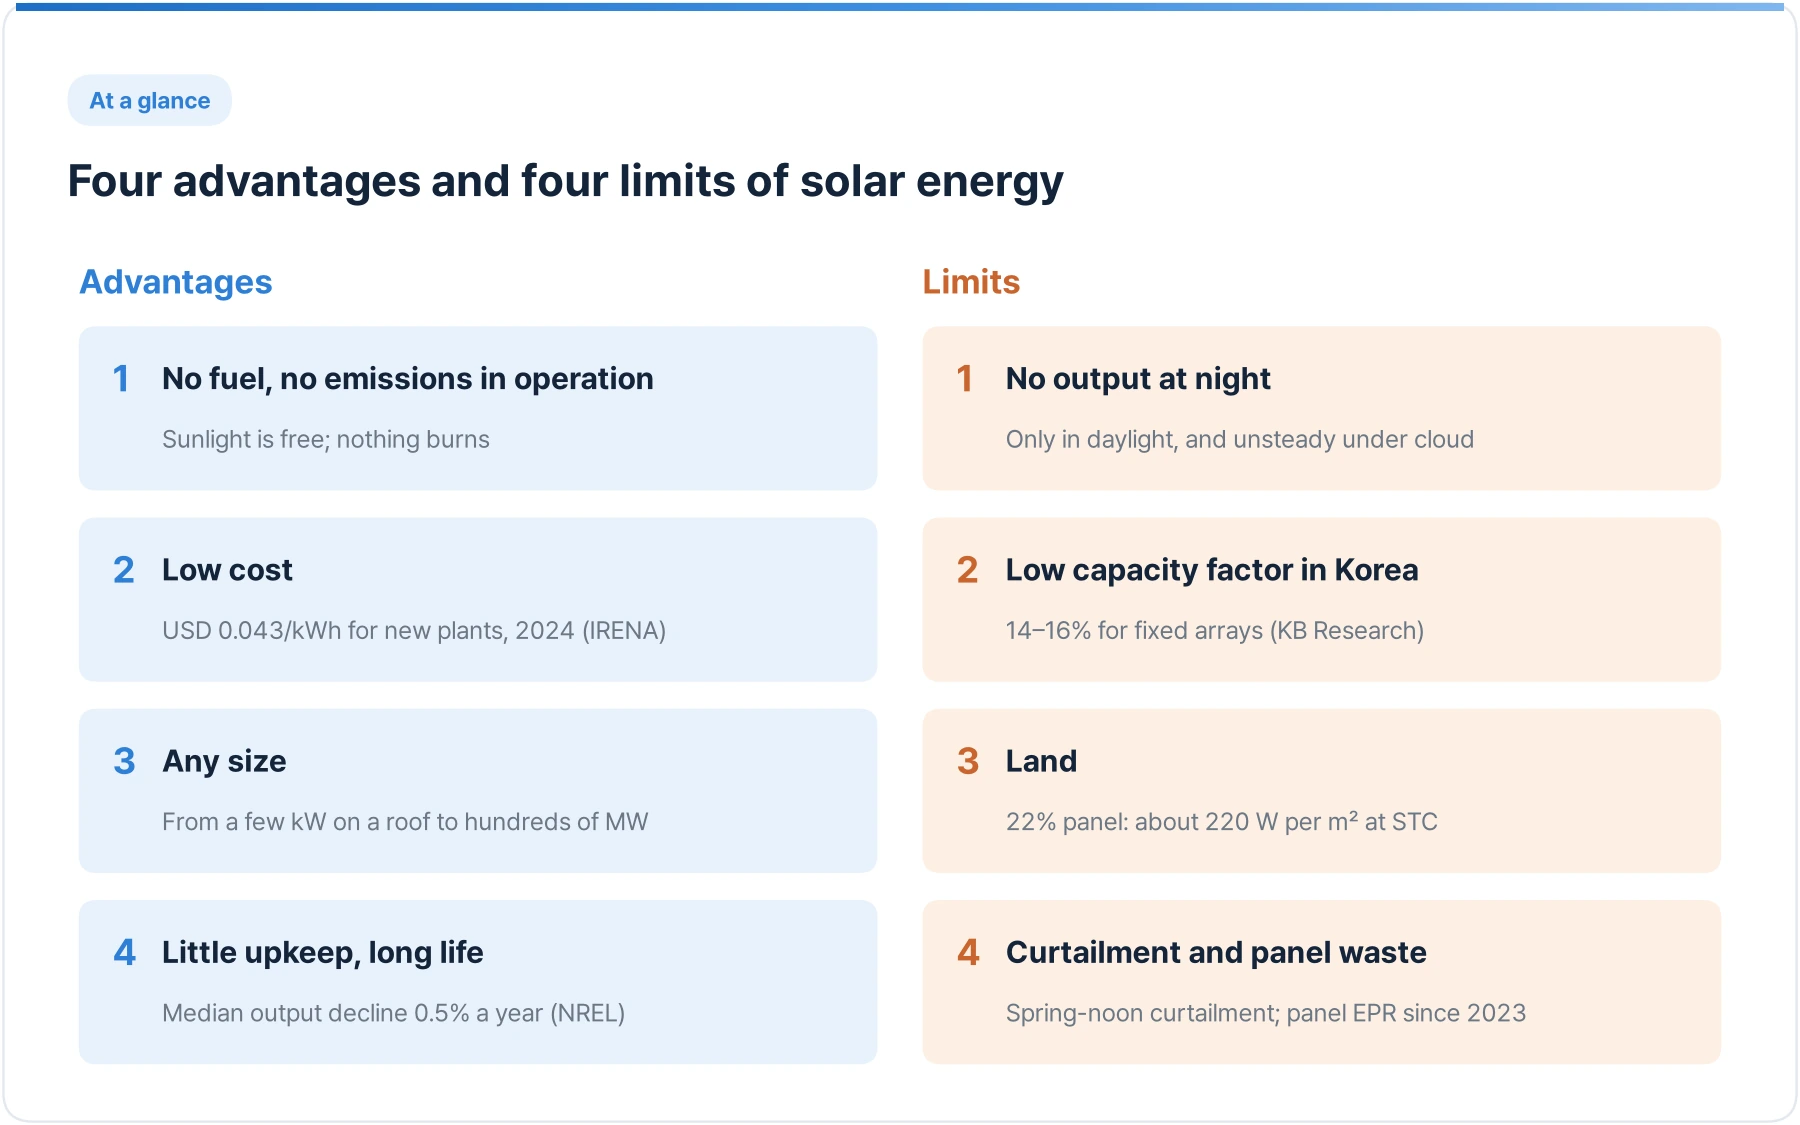
Advantage 1: no fuel, no emissions while running
The fuel is sunlight, so there is nothing to buy and generation cost does not move with oil and gas prices. Nothing burns, so no greenhouse gas or air pollutant is released while the panel runs. For a country that imports almost all of its energy, as Korea does, solar generation can reduce dependence on imported fuels, depending on which generation it displaces.
Making, shipping and installing panels does cause emissions. No emissions while running is not the same as no emissions over the life cycle.
Advantage 2: the cost has collapsed
Solar used to be the expensive option. IRENA puts the global weighted-average levelised cost of utility-scale solar commissioned in 2024 at USD 0.043 per kWh, and 91% of new utility-scale renewable capacity that year produced power more cheaply than the cheapest new fossil alternative.
That is a global average, pulled down by sunny regions. The same panel in weaker sun produces less, and its cost per kWh is higher (limit 2).
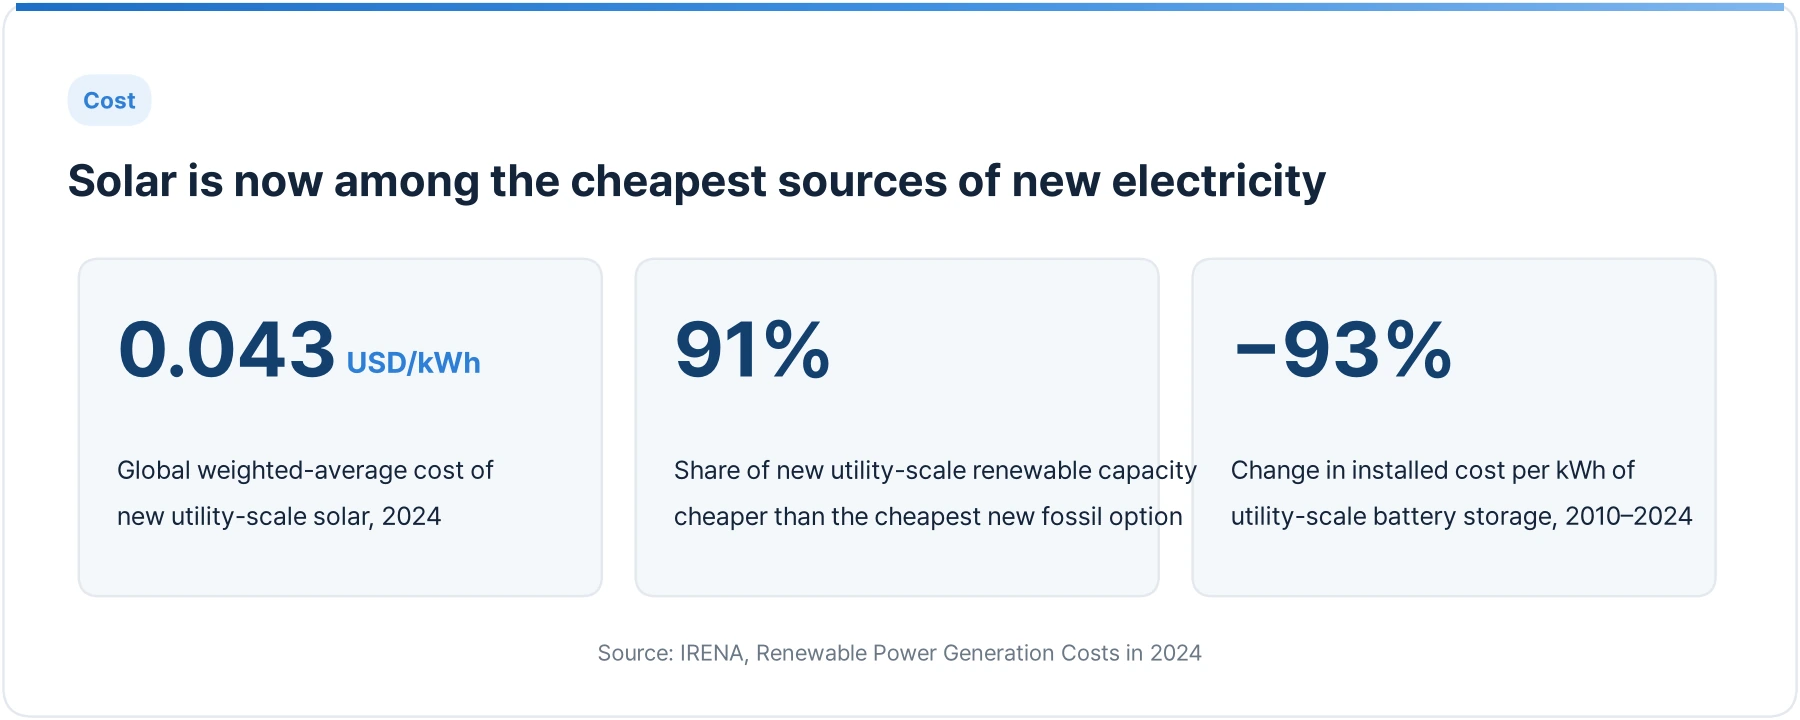
91% of newly commissioned utility-scale capacity delivering power at a lower cost than the cheapest, newly installed fossil fuel-based alternative.
Advantage 3: any size, close to where power is used
Solar scales by adding panels. The same technology covers a few kW on a house roof, a factory roof, a car park and a plant of hundreds of MW. It can be built next to the load, which cuts transmission losses, started small and extended later, and it goes up faster than large thermal plants.
Advantage 4: little upkeep, long life
There are no moving parts in a panel. Cleaning and inverter checks are most of the maintenance. Output declines slowly with age: NREL compiled nearly 2,000 measured degradation rates from around the world and found a median of 0.5% a year. Assuming a 0.5% decline each year, about 90% of the original output remains after 20 years. Actual degradation and warranty terms vary by product; output warranties of around 25 years are common.
Limit 1: nothing at night, unsteady under cloud
Solar produces only while the sun is up: zero at night, little in the morning and evening, most around noon. A passing cloud can swing output sharply within minutes. Across the year, long summer days are offset by the rainy season, and winter sun is short and low.
Solar alone therefore cannot follow demand. Power in the evening has to come from other generators or from storage.
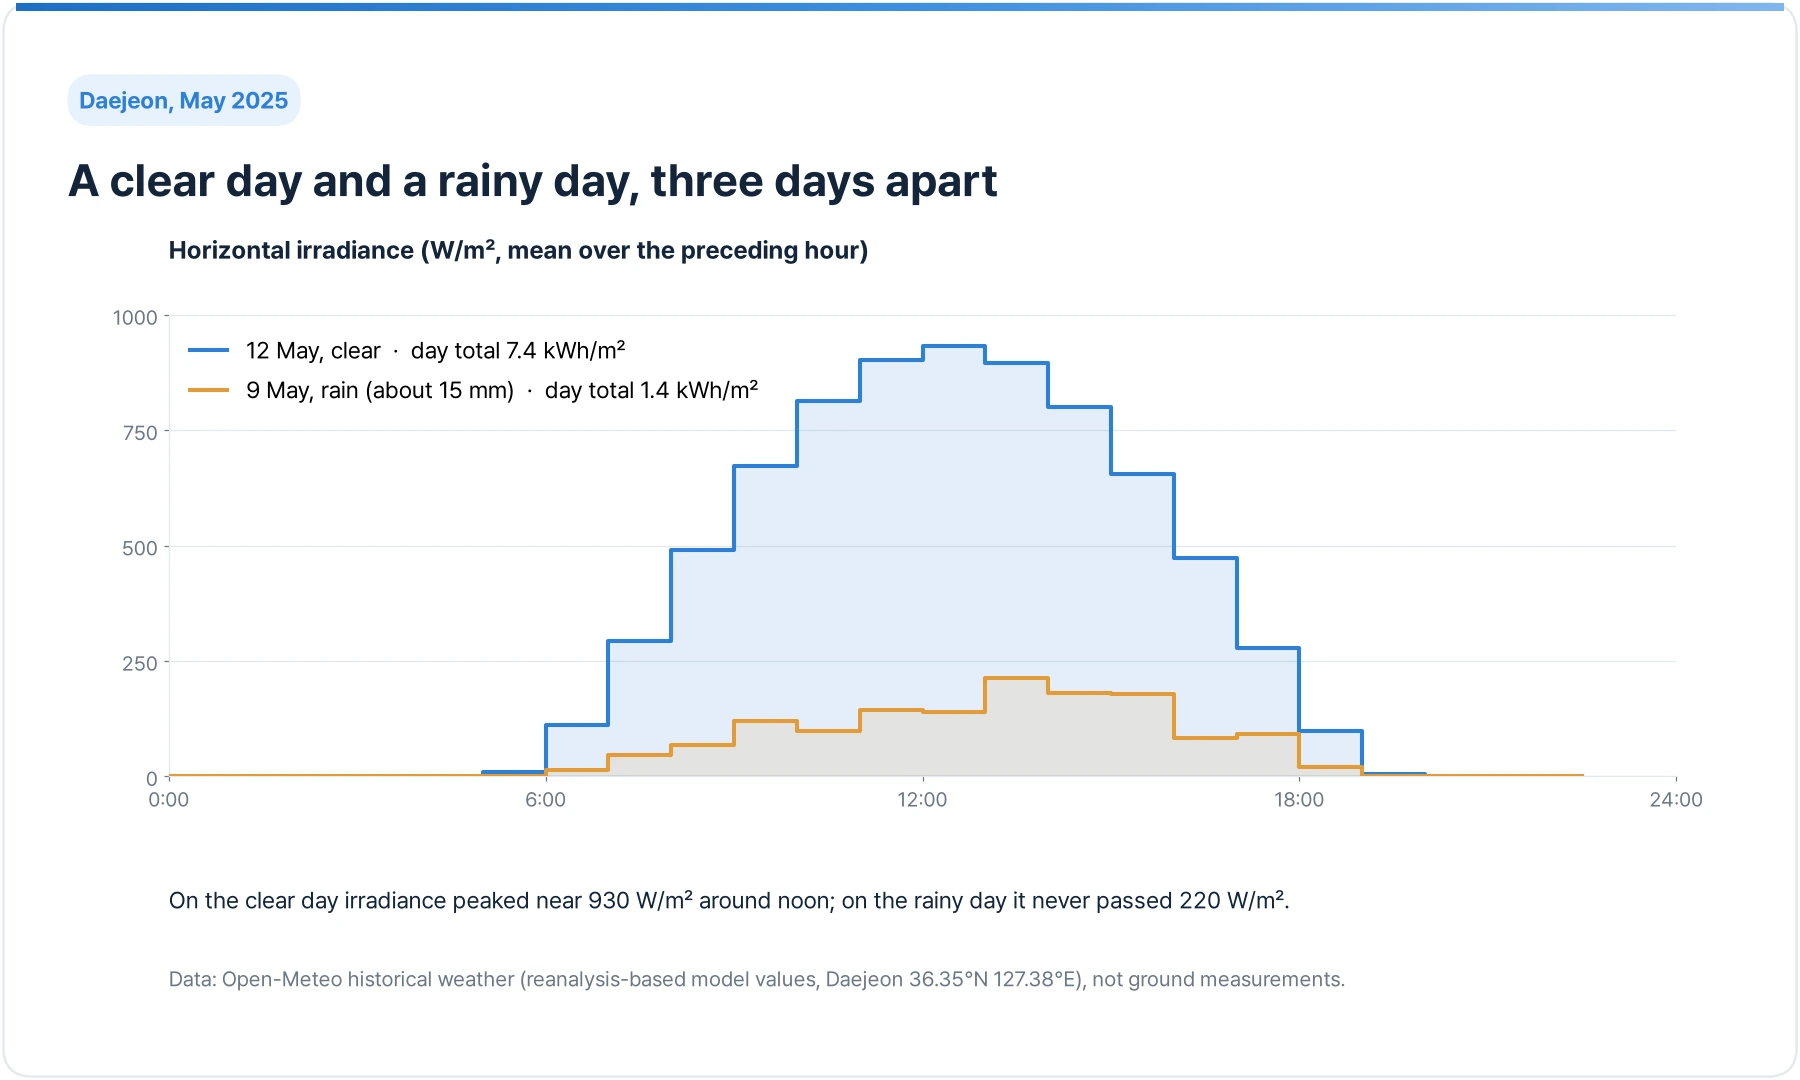
The chart shows hourly sunlight in Daejeon on two days three days apart in May 2025: the clear 12th and the rainy 9th (about 15 mm of rain). The horizontal-surface total was 7.4 kWh/m² against 1.4 kWh/m², more than five times apart. A panel's actual output ratio depends a little on tilt and temperature, but supply can swing this much with the weather. Anything running on solar power has to be designed for day-to-day variation.
Limit 2: a low capacity factor, lower in Korea
The same panel makes more electricity under stronger sun. KB Research puts a fixed array in Korea at 1,200 to 1,400 full-load hours a year, a capacity factor of 14 to 16%, typical of mid-latitude regions; sunny locations in Australia and the Middle East can exceed 1,700 hours.
| Full-load hours a year | Capacity factor | |
|---|---|---|
| Korea (fixed) | 1,200–1,400 | 14–16% |
| Sunny sites in Australia, Middle East | 1,700+ possible | About 19%+ |
A year has 8,760 hours. A 15% capacity factor means a 1 MW plant makes as much electricity in a year as it would running at 1 MW for about 1,300 hours. Levelised cost compares lifetime costs with lifetime output, so, other things being equal, a lower capacity factor raises the cost per kWh.
Strong summer sun is not the whole story either. Panels lose efficiency as they heat up, and the datasheet gives this as the temperature coefficient of maximum power: the percentage of output lost for each degree the cell warms. At the same irradiance, a panel with a coefficient of −0.35%/°C produces about 12% less with cells at 60 °C than at 25 °C, and cells can reach that on a summer afternoon. Output per unit of sunlight is therefore often best in clear, cool spring weather.
What ten years of sunlight in Daejeon show
Sunlight data for Daejeon (Open-Meteo reanalysis-based model values, not ground measurements) gives a sense of where these numbers come from. A surface tilted 30° to the south receives an average of 1,699 kWh/m² a year. Panels are rated at 1,000 W/m², so with no losses at all that would be about 1,700 full-load hours. Taking annual output as 1,200 to 1,400 kWh per kW, that is about 71 to 82%; the rest goes on panel temperature, inverter conversion, wiring, dust and shading. Output compared with the sunlight the same plant received over the same period is called the performance ratio, a standard measure of how well a plant is running. This is an illustrative calculation; a real plant's performance ratio comes from its own measurements.
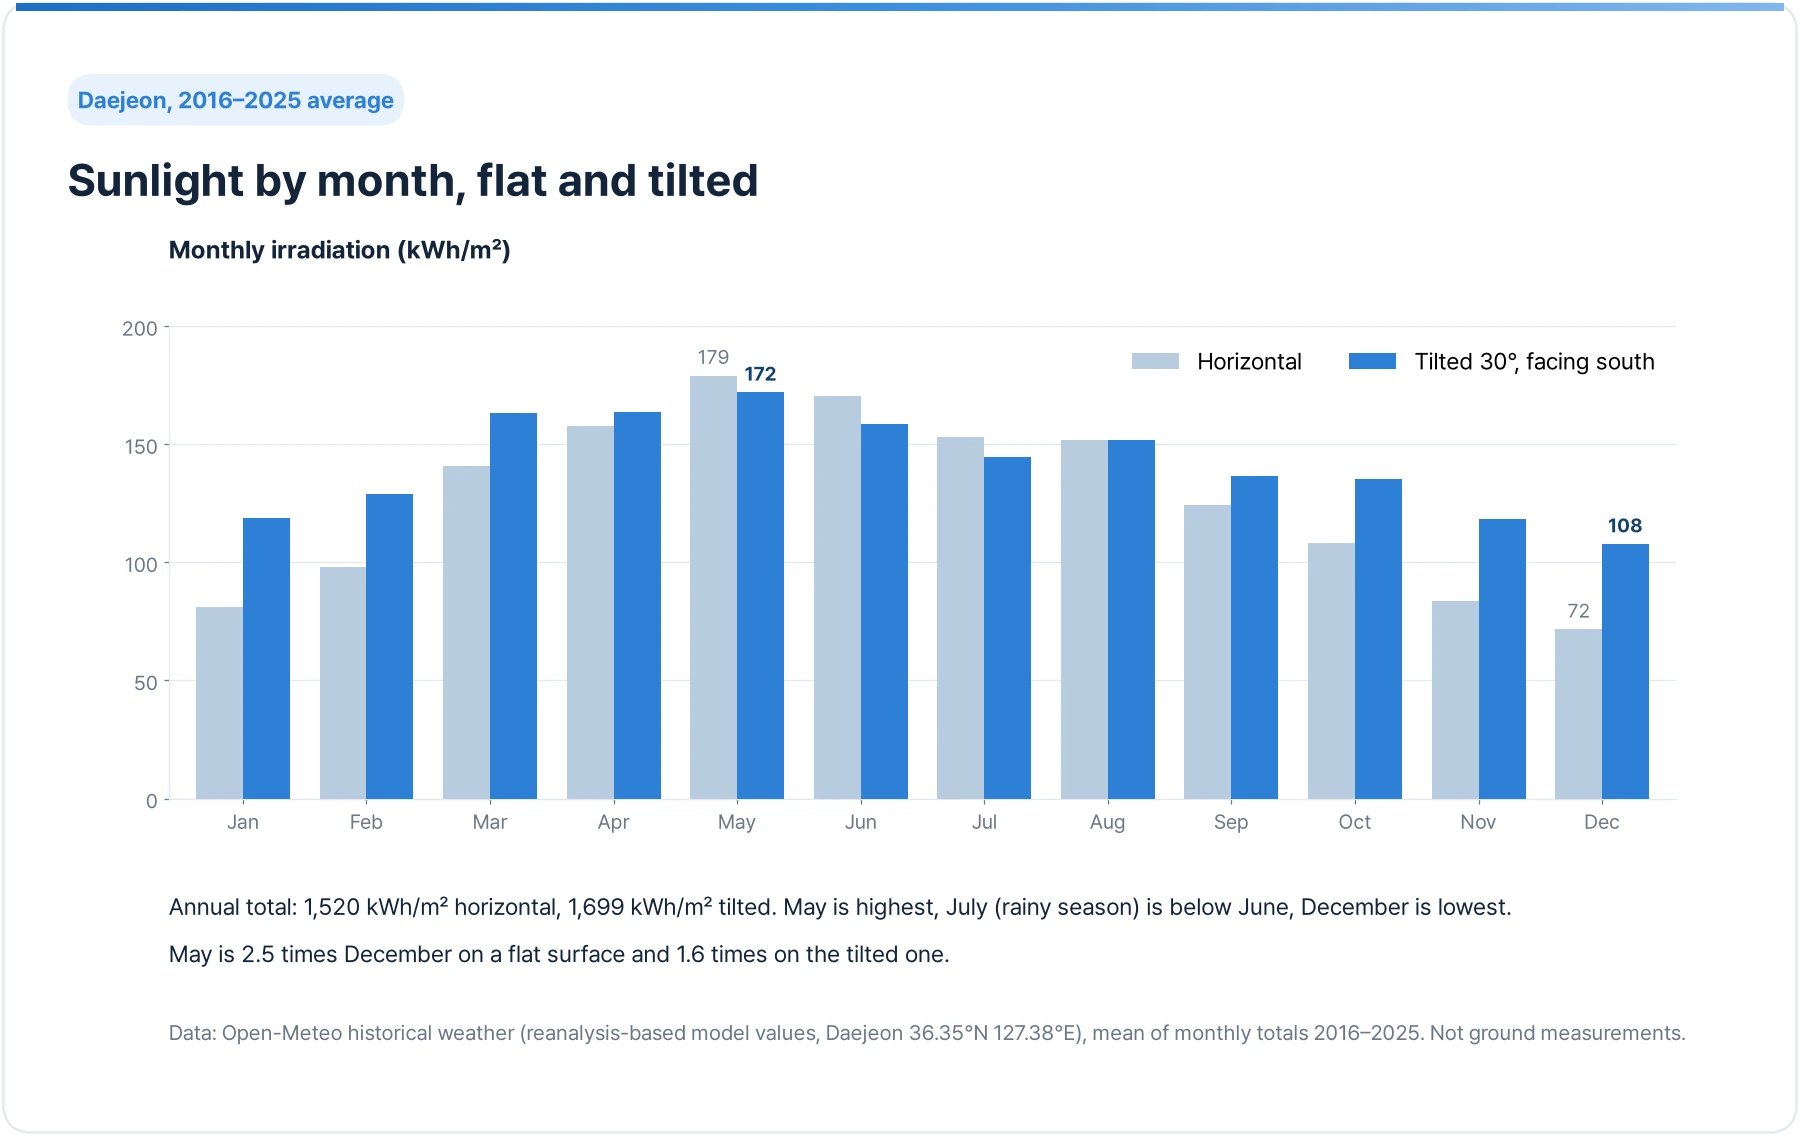
The seasons differ a lot. May is the sunniest month in Daejeon, July, in the rainy season, is lower than June, and December is lowest. On a flat surface May receives 2.5 times as much as December. Tilting the panel 30° to the south catches the low winter sun more squarely, raising December from 72 to 108 kWh/m² and narrowing the gap to 1.6 times. That is why a flat-mounted roof array and a tilted one differ so much in winter.
How much a 3 kW roof and a 1 MW plant produce
With the capacity factor and the sunlight data, output can be worked out directly. We take 1,300 kWh a year per kW in Korea, the middle of the 1,200 to 1,400 kWh range, and split it by month in proportion to the tilted-surface sunlight above. Losses that change by month, such as summer heat, are left out, so these are rough figures.
| Year | Daily average | May | December | Module area | |
|---|---|---|---|---|---|
| 1 kW | About 1,300 kWh | About 3.6 kWh | About 130 kWh | About 80 kWh | About 4.5 m² |
| 3 kW roof | About 3,900 kWh | About 11 kWh | About 400 kWh | About 250 kWh | About 14 m² |
| 1 MW plant | About 1,300 MWh | About 3.6 MWh | About 130 MWh | About 80 MWh | About 4,500 m² of modules; the site is larger |
Module area assumes 22% efficient panels (1 kW at 220 W per m²). The same installation makes a little over 60% as much in December as in May, and, as the two days above show, daily sunlight can differ more than fivefold with the weather. Supply that is not steady by the month or by the day is the first thing to design for when equipment runs on solar power.
How much orientation and tilt matter
Roofs often do not face south, and the tilt is not always a free choice. Using the same ten years of Daejeon data, we compared the annual sunlight on surfaces facing different ways.
| Orientation, tilt | Year (kWh/m²) | vs south 30° | June | December |
|---|---|---|---|---|
| South, 30° | 1,699 | 100% | 159 | 108 |
| South, 15° | 1,650 | 97% | 168 | 92 |
| South, 45° | 1,665 | 98% | 142 | 117 |
| Flat | 1,520 | 89% | 170 | 72 |
| East, 30° | 1,417 | 83% | 157 | 68 |
| West, 30° | 1,403 | 83% | 156 | 67 |
| South, vertical (wall) | 1,115 | 66% | 68 | 107 |
Facing south, any tilt from 15° to 45° comes within 3% over the year, so following the roof pitch costs little. Facing east or west at the same 30° loses about 17% over the year, and in December falls to about 63% of south at 30°. A panel on a south-facing wall gets only 66% over the year, but in winter it faces the low sun squarely and receives about as much as south at 30° in December. Raising a south-facing tilt from 30° to 45° gives up some summer sunlight and adds about 9% in December, which suits sites that need more power in winter; going all the way to vertical lowers December again. The table compares sunlight only; nearby shading and panel temperature are not included.
Limit 3: land
Sunlight arrives spread out, so a lot of electricity needs a lot of area, and rows of panels need gaps so they do not shade each other. In a small, mountainous country like Korea, finding the land is itself a major task, and hillside installations have raised concerns about landscape and landslides.
Hence the growth of sites already in use: roofs, car parks, industrial estates and reservoir surfaces (floating solar). Agrivoltaics, with panels raised above working farmland, is also under consideration.
Limit 4: grid strain and panel waste
As solar grows, there are clear middays when output exceeds what demand and the grid can take. The grid has to match supply to demand at every moment, so some generators are ordered to cut output, which is curtailment. In Korea it happens most in Jeju and the Honam region, where solar is concentrated, on spring days when demand is low and sun is strong. Electricity that could have been made is thrown away.
The other issue is end-of-life panels. Panels installed in the 2000s and 2010s are reaching replacement age. Since January 2023 Korea has applied extended producer responsibility (EPR) to solar panels, making manufacturers and importers responsible for collection and recycling. Recovering glass, aluminium, silicon and silver, and the collection system around it, are still maturing.
Pros and cons at a glance
| Point | Number | |
|---|---|---|
| Advantage 1 | No fuel, no emissions while running | Fuel cost zero |
| Advantage 2 | Low generation cost | USD 0.043/kWh (new utility-scale, 2024, global weighted average) |
| Advantage 3 | Any size, close to the load | A few kW to hundreds of MW |
| Advantage 4 | Little upkeep, long life | Median output decline 0.5% a year |
| Limit 1 | Nothing at night, varies with weather | Zero output after sunset |
| Limit 2 | Low capacity factor in Korea, seasonal swing | 14–16%; Daejeon sunlight May/December 1.6× on a 30° tilt |
| Limit 3 | Land | About 220 W per m² of module area at STC for a 22% efficient panel; sites also need spacing |
| Limit 4 | Curtailment, panel waste | Panel EPR since 2023 |
- Renewable energy pros and cons→Solar and wind together, and where hydrogen fits.
Storage closes the gap
The timing mismatch in limit 1 and the curtailment in limit 4 come from the same problem: too much at noon, too little in the evening. Storing the surplus and using it later reduces both. Panel waste is a separate matter that needs collection and recycling.
| Storage | Suited to | Limit |
|---|---|---|
| Battery | Moving midday power into the evening, over hours. Installed cost per kWh of utility-scale battery capacity fell 93% from 2010 to 2024 (IRENA) | Costly per unit of capacity for storage over days or seasons |
| Hydrogen (electrolysis) | Storing large amounts for long periods; use as fuel and feedstock, not only power | Large losses going from power to hydrogen and back to power |
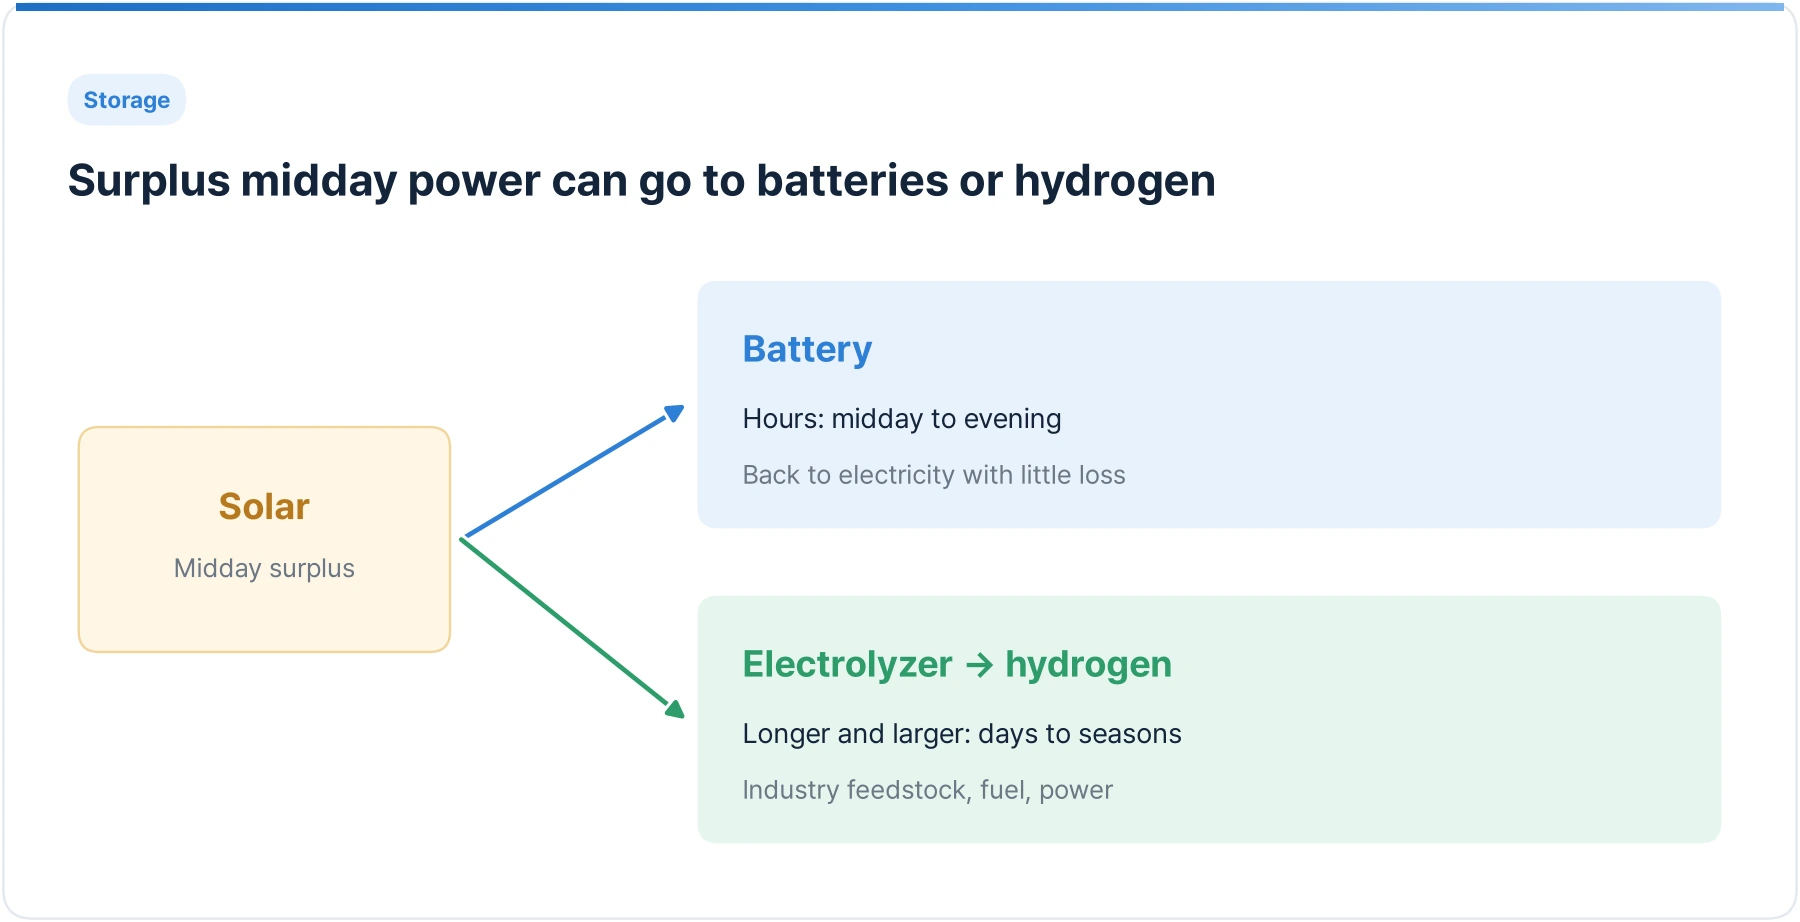
Batteries suit shifting power within a day. Hydrogen suits storage across seasons and the industrial processes that are hard to electrify.
How much hydrogen can solar power make? If all of the roughly 1,300 MWh a 1 MW plant produces in a year goes to an electrolyzer, and the system uses 55 kWh per kg of hydrogen, the result is about 24 tonnes a year. That averages about 65 kg a day, but by month it is about 2.4 tonnes in May and 1.5 tonnes in December. An electrolyzer rated below the solar array, or one that cannot use the weak morning and evening power, will make less.
Connecting an electrolyzer straight to solar means its power input falls every time the sun goes down. How far an electrolyzer can be turned down on a solar supply, with our measurements, is covered in a separate post.
- Running an electrolyzer on solar→How far down you can turn it, with our crossover data.
- Power to gas, and back again→Turning surplus renewable power into hydrogen.
- Hydrogen flow units→Converting between kg, Nm³ and kg/day.
How big should the electrolyzer be?
An electrolyzer on solar does not need the same capacity as the array, because the array seldom produces close to its rating. Calculated from Daejeon sunlight, an electrolyzer rated at 50% of the solar capacity still uses about 91% of the output. Its full-load hours rise to 2,374 a year, about 1.8 times the 1,300 hours of an electrolyzer the same size as the array.
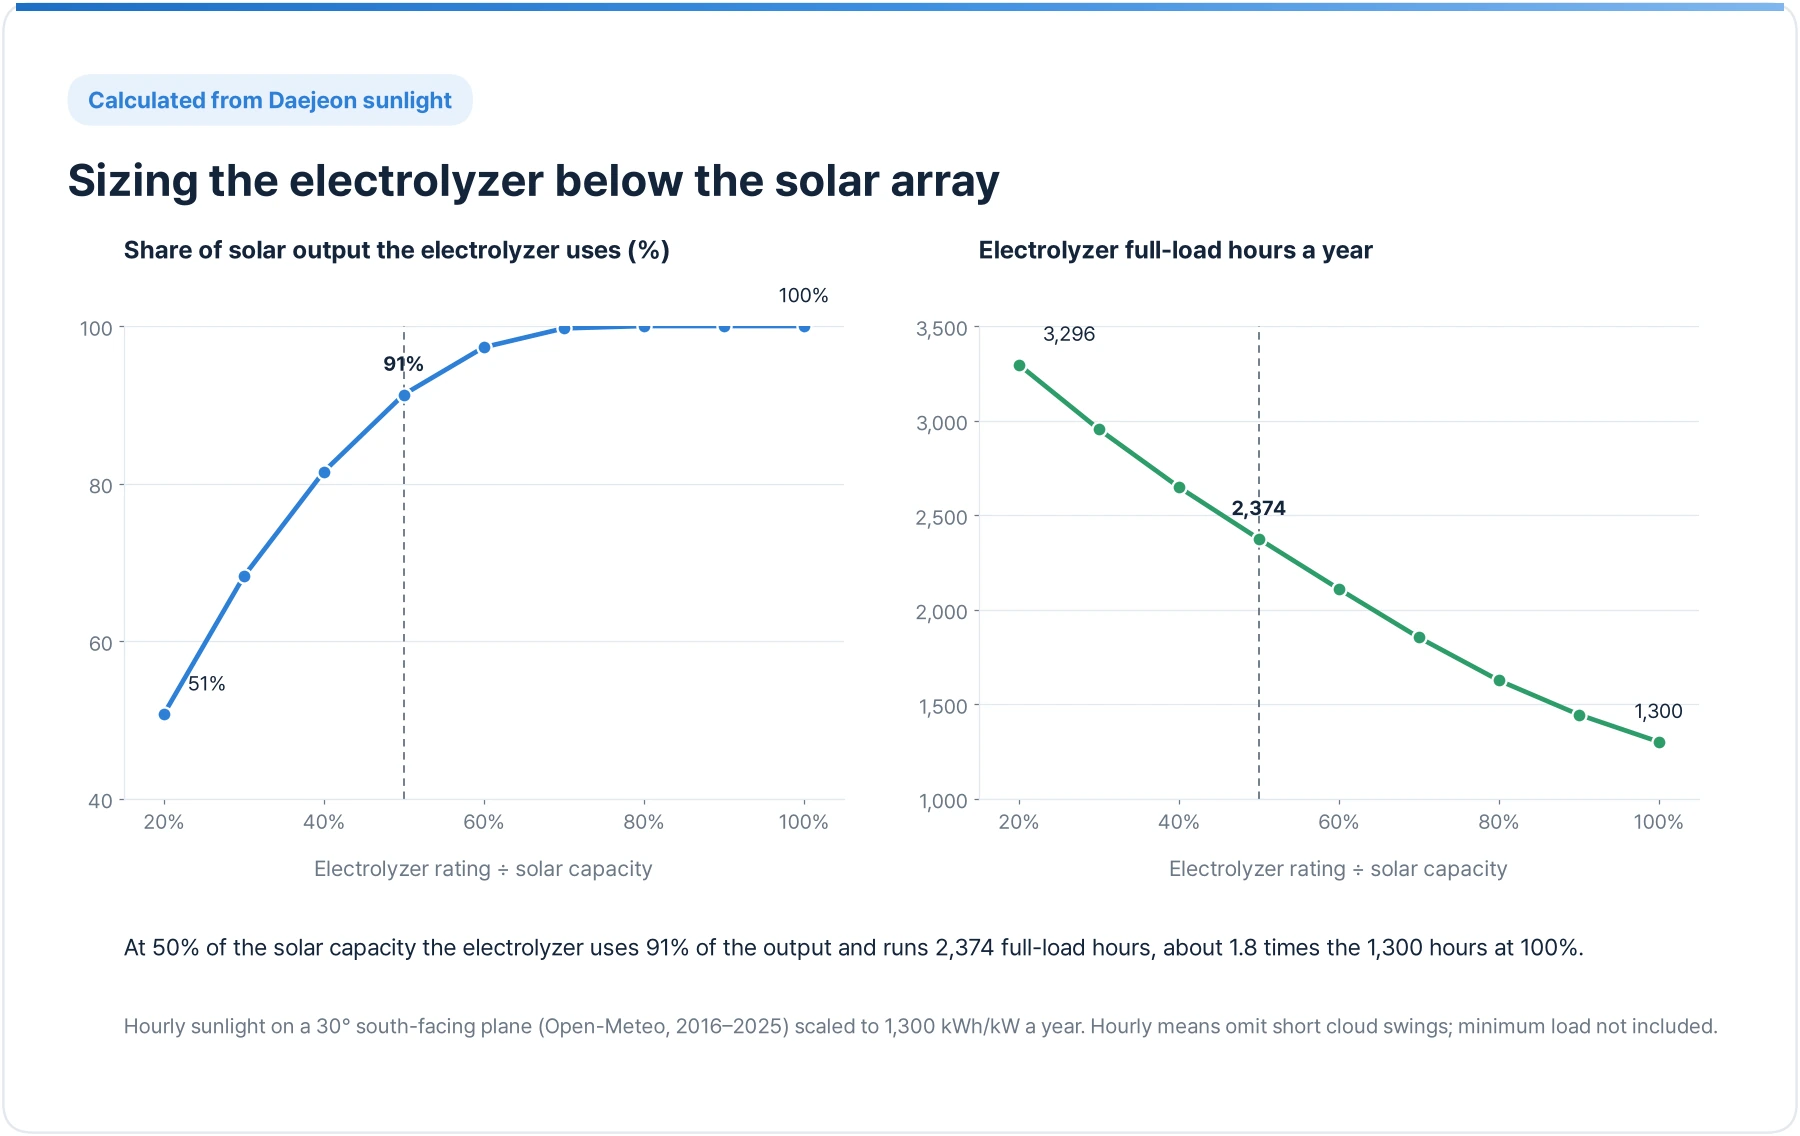
With 1 MW of solar and a 0.5 MW electrolyzer, hydrogen output is about 21.6 tonnes a year, roughly 9% less than with a 1 MW electrolyzer (about 24 tonnes), with half the rated electrolyzer capacity. The right ratio depends on equipment price, electricity cost and whether surplus power has another use. The calculation uses hourly mean sunlight, so short cloud swings are missing, and it does not include the electrolyzer's minimum load.
- Running an electrolyzer on solar→How far down you can turn it, with our crossover data.
Frequently asked questions
What is the biggest disadvantage of solar energy?
It only produces while the sun is up. Output is zero at night and unsteady under cloud, so generation and demand do not line up, and storage or other generators have to fill the gap.
Is Korea a poor place for solar?
On sunlight alone it is not favoured: a fixed array in Korea has a capacity factor of 14 to 16%, typical of mid-latitude regions and lower than sunny sites in Australia or the Middle East. Land is also scarce, which is why roofs, industrial sites and water surfaces matter.
How much does a 3 kW solar array produce a day?
At Korea's 1,200 to 1,400 full-load hours a year (a 14 to 16% capacity factor), a 3 kW array makes about 3,600 to 4,200 kWh a year, or about 10 to 11.5 kWh a day on average. It varies with the season: split by Daejeon's sunlight, May gives about 400 kWh for the month and December about 250 kWh. Daily sunlight can differ more than fivefold with the weather.
How much hydrogen can 1 MW of solar make?
If all of the roughly 1,300 MWh a 1 MW array makes in a year goes to electrolysis at 55 kWh per kg for the whole system, about 24 tonnes a year, or 65 kg a day on average. Actual production varies with each year's solar generation, and falls if the electrolyzer cannot use all the power because of its rating or minimum load.
Which way should solar panels face, and at what tilt?
Among the orientations and tilts compared on ten years of Daejeon sunlight, south at 30° received the most over a year. Any south-facing tilt from 15° to 45° was within 3%, while east or west at 30° was about 17% lower. Raising the tilt to around 45° helps if winter output matters more.
Should the electrolyzer match the solar capacity?
It does not have to. Calculated from Daejeon sunlight, an electrolyzer rated at 50% of the solar capacity still uses about 91% of the output and runs about 1.8 times as many full-load hours (hourly means, minimum load excluded). Equipment price, electricity cost and minimum load decide the ratio.
How long do solar panels last?
Around 25 years is the usual reference. The median decline in output is about 0.5% a year (NREL); at that rate about 90% remains after 20 years, though actual degradation varies by product and site. Inverters are usually replaced before the panels.
Why does solar curtailment happen?
The grid must balance supply and demand at every moment. When solar output peaks on low-demand spring days in regions with a lot of solar, there is a surplus, and some generators are told to cut output to keep the grid stable. More storage and transmission reduce it.
Can solar power be used to make hydrogen?
Yes. Using solar electricity to split water in an electrolyzer produces hydrogen with almost no carbon emissions, often called green hydrogen. Because solar output varies through the day, the electrolyzer's operating range and the number of units need to be designed together.
Looking at AEM for a specific application?