Our HXS-2 23-cell stack has run for more than 3,000 hours at 50 A. The test conditions, how the operating hours were counted, how to read the average cell voltage and hydrogen-in-oxygen curves, and what the record can and cannot tell you.
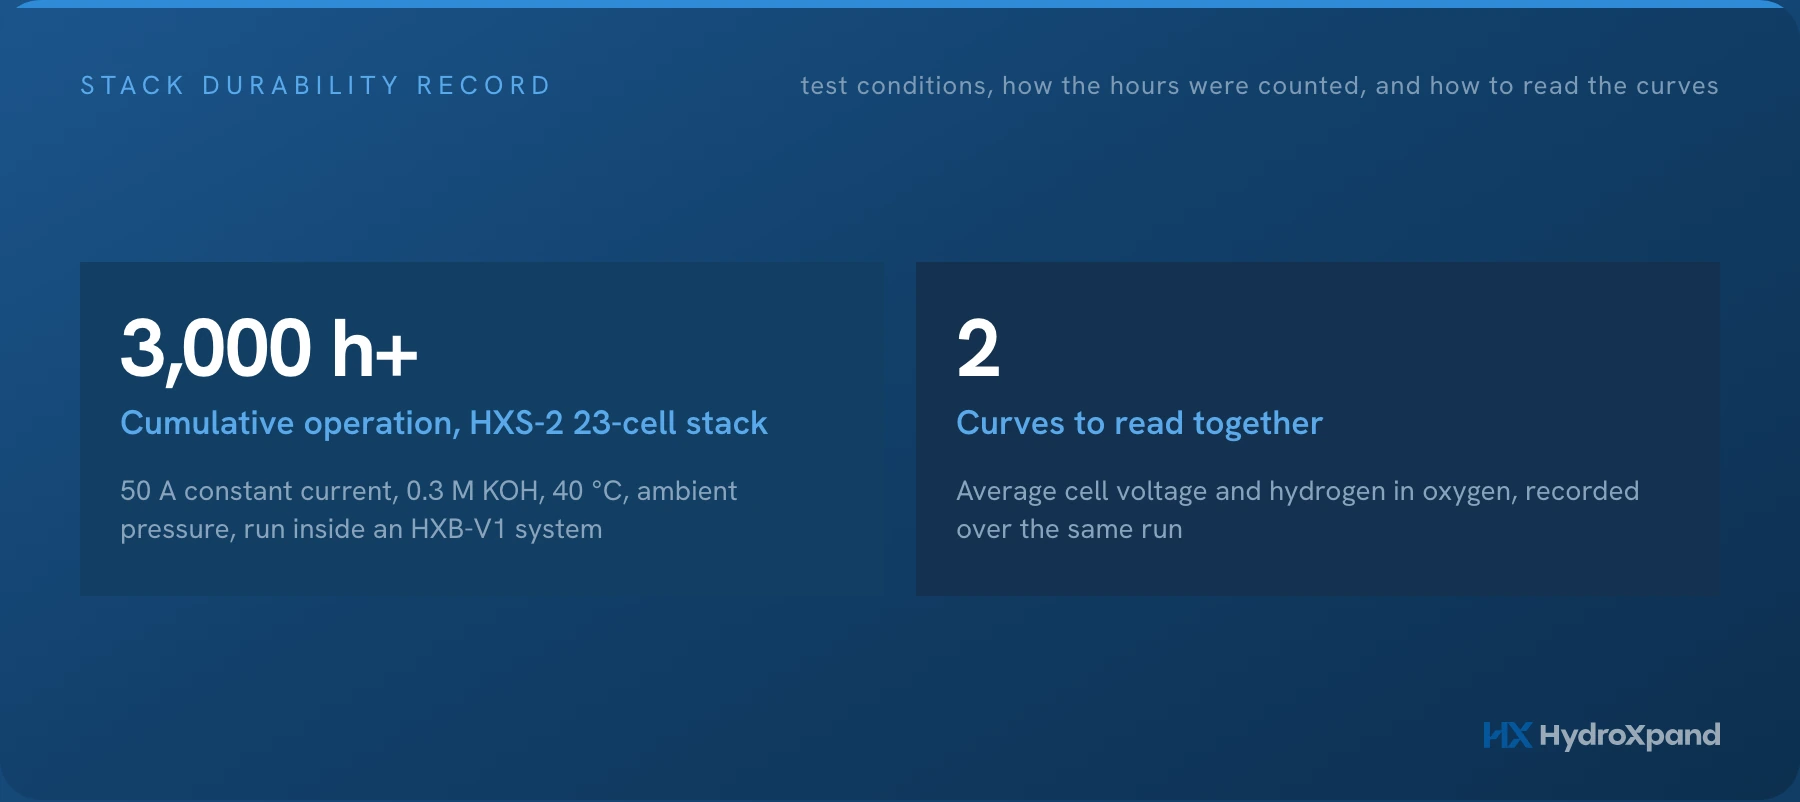
Stack durability is often quoted as a single number. The same 3,000 hours can mean different things, depending on the conditions and on how the hours were counted. This article sets out the test conditions behind our record, how we counted the hours, how to read the curves, and what the record does and does not show.
For general guidance on reading durability figures, see our article on durability data.
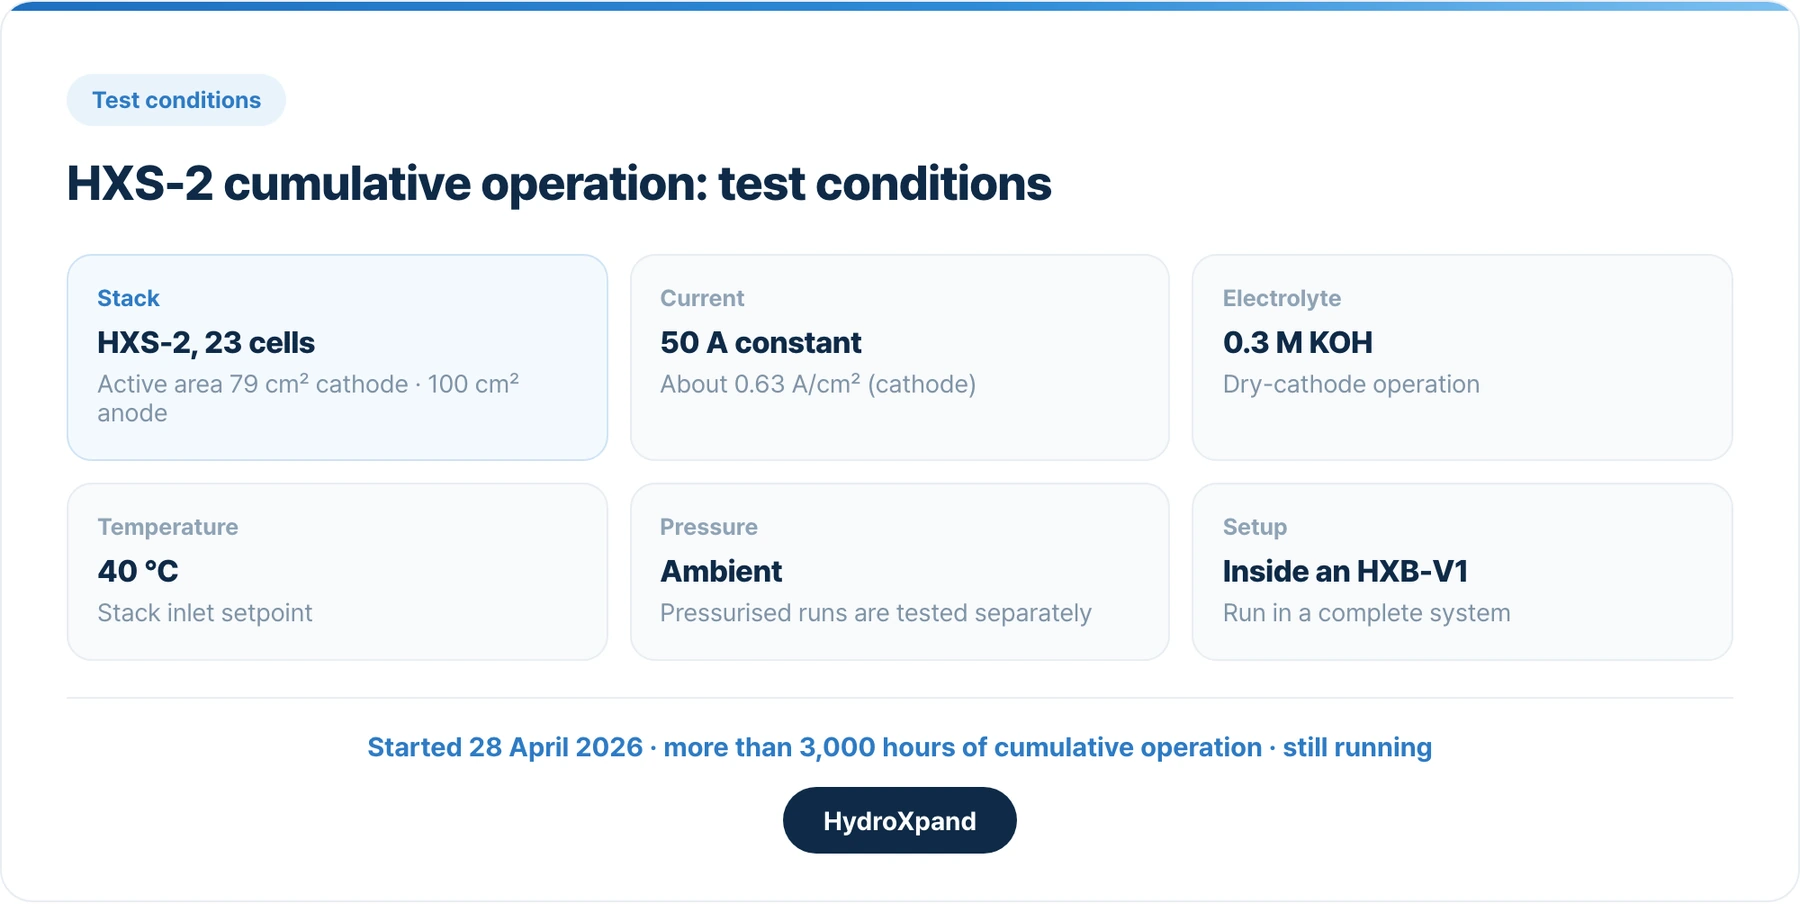
- Check the test conditions first. This is a 23-cell stack at 50 A constant current, 0.3 M KOH, 40 °C and ambient pressure.
- Separate cumulative hours from hours without interruption. The 3,000 hours add up the time current was flowing, excluding stops.
- Read the voltage as a trend. Short-lived changes after a restart are different from the slow rise during operation.
- Do not treat it as a lifetime prediction. It is one stack under one set of conditions.
Test conditions
| Item | Condition |
|---|---|
| Stack | HXS-2, 23 cells |
| Active area per cell | 79 cm² cathode (100 cm² anode) |
| Current | 50 A constant (about 0.63 A/cm² on the cathode area) |
| Electrolyte | 0.3 M KOH |
| Temperature | 40 °C (stack inlet setpoint) |
| Pressure | Ambient |
| Operation | Dry cathode |
| Start | 28 April 2026 |
The stack runs inside an HXB-V1 system. Power, electrolyte circulation, make-up water and gas analysis are all handled by the system, so this is a record from complete equipment rather than a laboratory test bench. The run is still going.
The curve in our HXS-2 durability note comes from a different HXS-2 stack that ran earlier under the same conditions. The curves in this article are from the stack that has been running since April 2026.
- HXS-2 durability note→The earlier stack under the same conditions.
How the operating hours were counted
We counted only the time when more than 5 A was flowing. Current drops to 0 A when the system stops, so stopped time is excluded automatically. Data are logged every minute, and only minutes with a record were added. Counted this way, cumulative operation passed 3,000 hours at the end of September 2026.
| Measure | Meaning |
|---|---|
| Cumulative operating hours | Total time with current flowing, excluding stops |
| Hours without interruption | Longest stretch without a single stop |
The two numbers answer different questions. Cumulative hours show how long the stack has been used in total; the longest uninterrupted stretch shows how long it can run from a single start. If your application needs weeks of operation without a break, ask for the second figure separately.
Reading the cell-voltage curve
The curve shows the stack voltage divided by 23, as hourly means. The x-axis is cumulative operating time with stops removed, and the dashed lines mark restarts after a stop.
- The slow rise during operation. At constant current, cell voltage rises gradually as the electrodes, membrane and ionomer degrade. In a constant-current test this slope is what durability is judged on.
- The change after a restart. After a stop, the voltage runs lower for a while and then returns to its earlier trend.
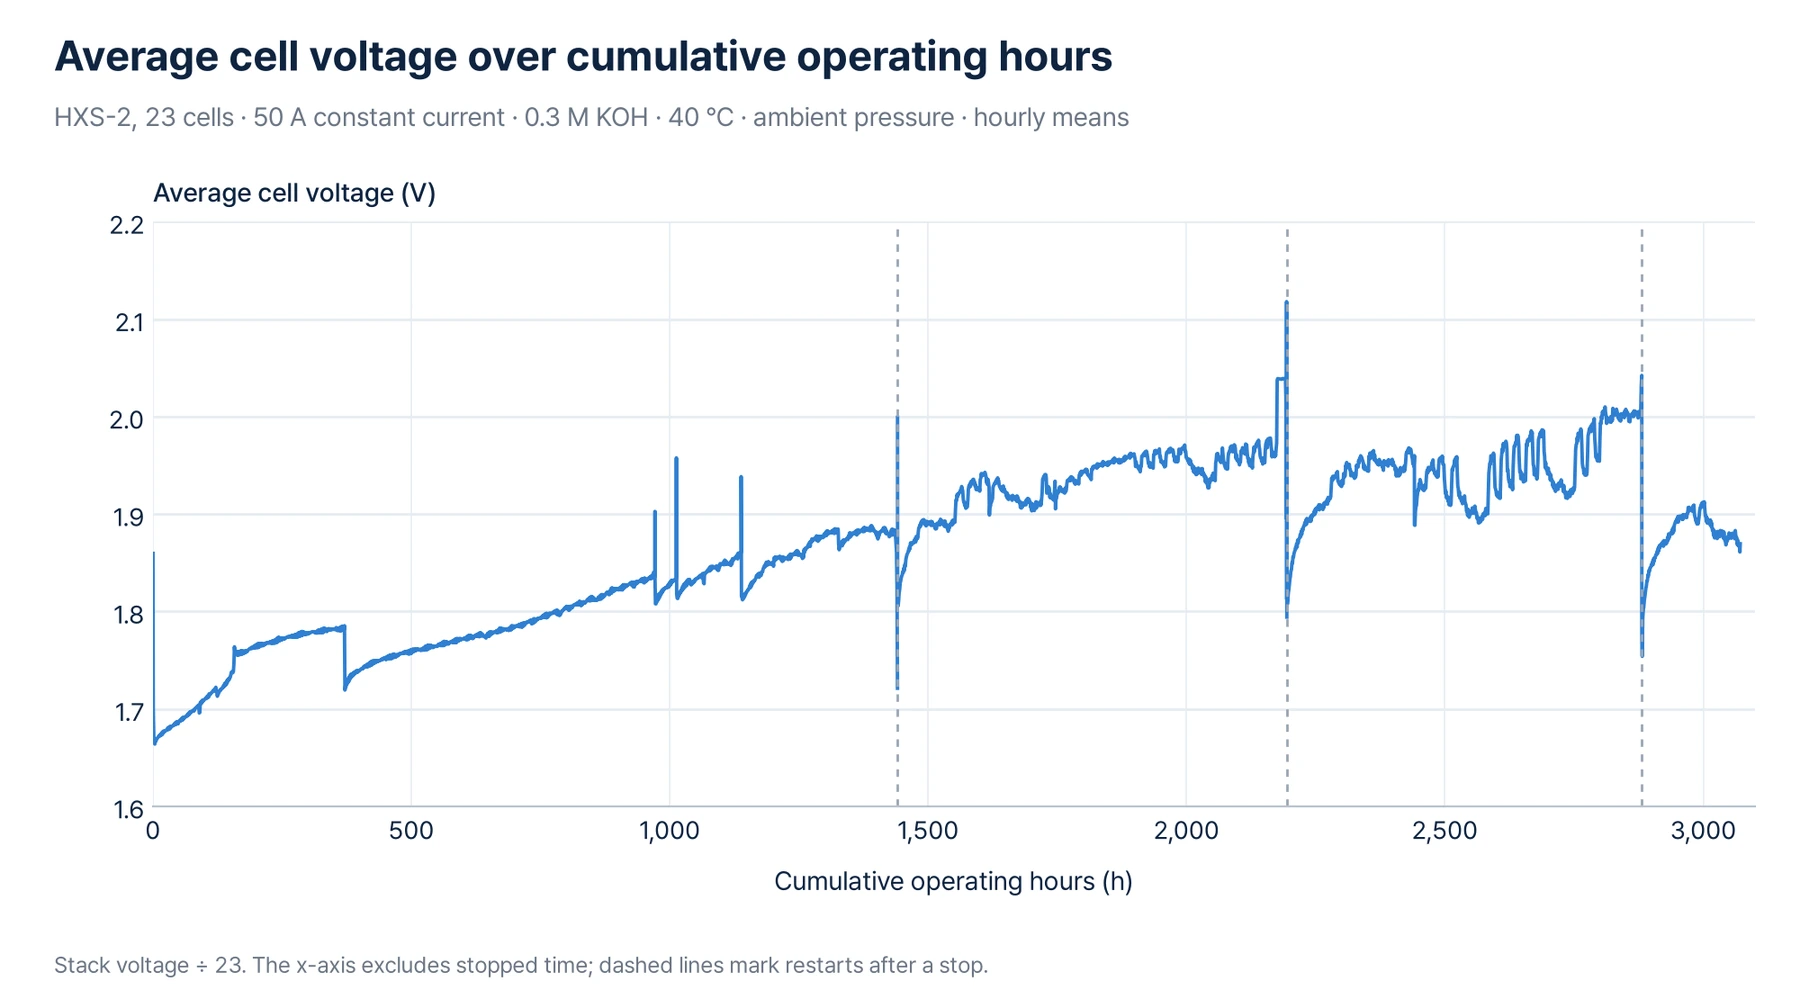
Do not conclude that performance improved from the low voltage just after a restart, or that degradation is fast from the high voltage just before a stop. Read the trend within each stretch.
Reading the hydrogen-in-oxygen curve
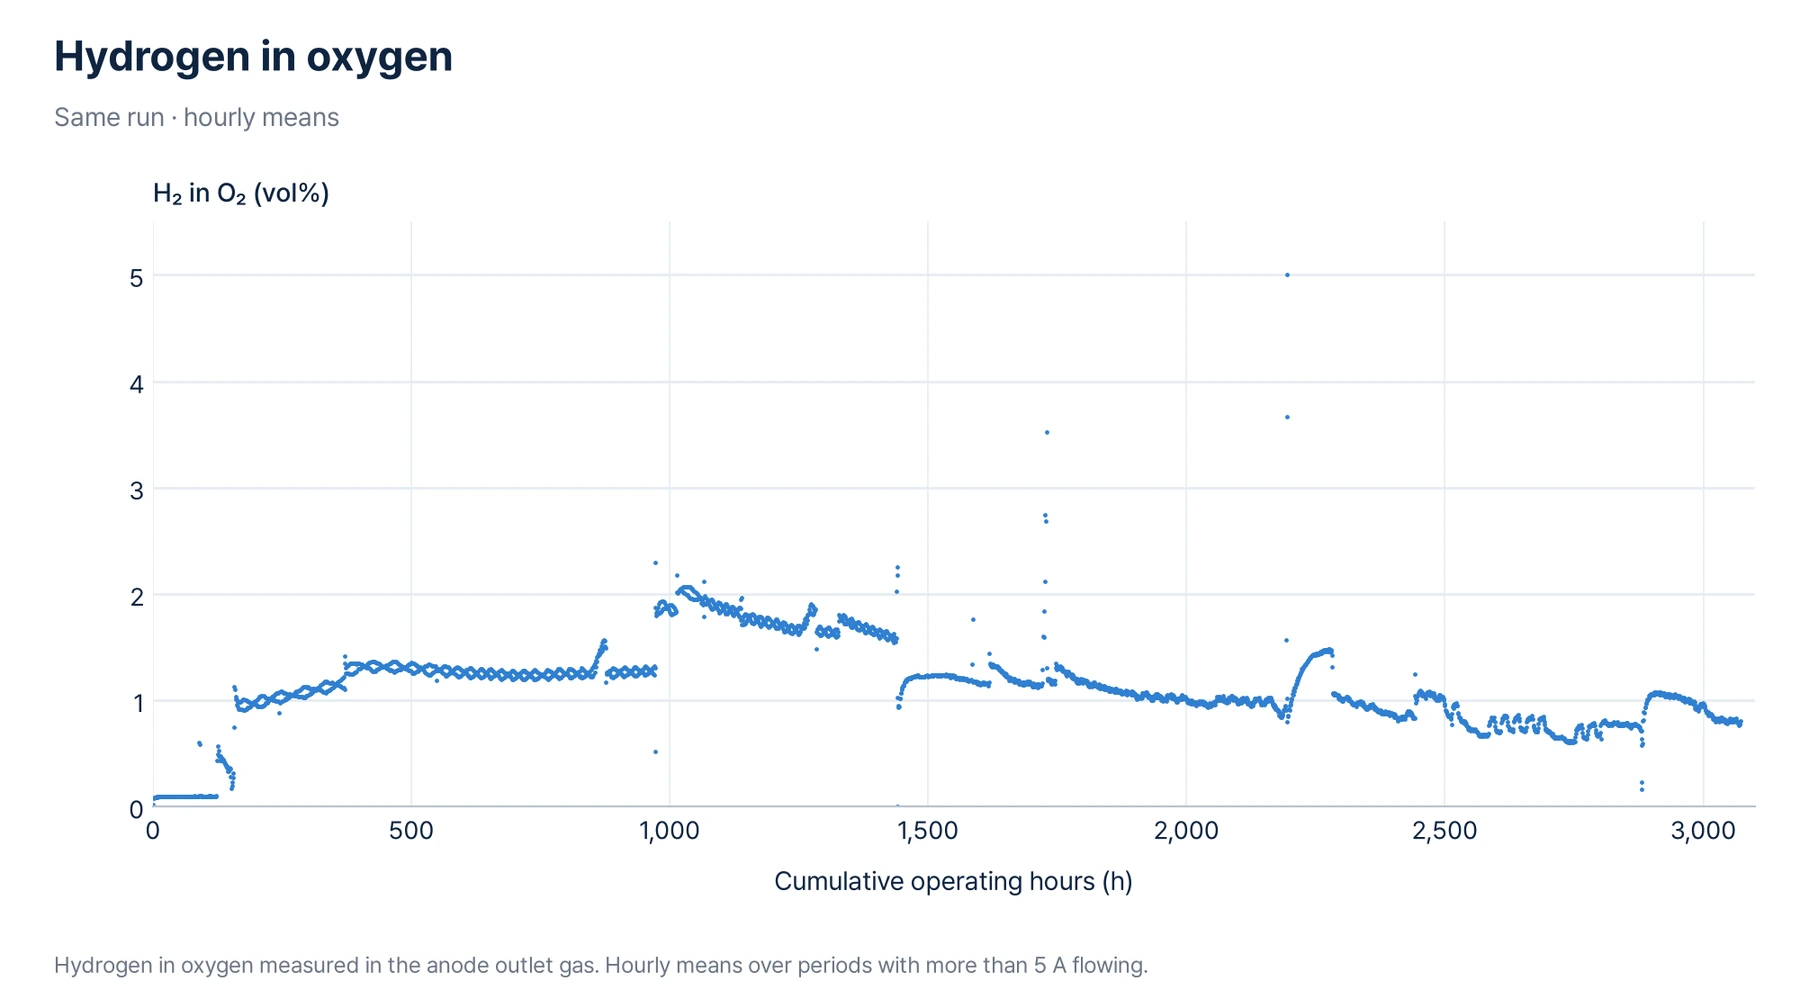
In AEM electrolysis, some of the hydrogen produced at the cathode crosses the membrane and mixes into the oxygen on the anode side. This crossover is measured as hydrogen in oxygen (H₂ in O₂). It is a safety parameter, so it is logged alongside voltage throughout a durability test.
In this record, 94% of the hourly means fall between 0.5 and 2 vol%, and the overall mean is about 1.1 vol%.
Crossover tends to rise at lower current and higher pressure. This record is at 50 A and ambient pressure, so values at part load or under pressure will differ.
Five things we learned from 3,000 hours
We analysed the curves together with the operating logs. The points below also apply to durability tests on single cells and short stacks.
The first few hundred hours need to be read separately. Average cell voltage rose by about 0.1 V over the first 200 hours and then rose much more slowly. In a freshly assembled cell the voltage changes quickly while the membrane, ionomer and electrode interfaces settle. A degradation rate calculated over a window that includes this period comes out far higher than the long-term trend, so check which window a rate was calculated over before comparing results.
Short fluctuations are mostly temperature. Comparing the short fluctuations in the curve with the stack inlet temperature shows a clear inverse relationship: in this record, a 1 °C drop in inlet temperature raised cell voltage by about 6–8 mV. Make-up water and changes in ambient temperature shift the electrolyte temperature, so log temperature alongside voltage to avoid reading fluctuations over a few days as degradation. If you are comparing materials on differences of a few millivolts in a short test, hold temperature within 0.5 °C.
The value just after a restart does not represent the stretch. After a stop, the voltage runs lower for a while and returns to its earlier trend over tens to hundreds of hours. If a test was interrupted, do not join the value just after the restart to the value just before the stop; compare values from each stretch once it has settled.
Gas purity moves independently of voltage. Later in the run, cell voltage was higher but hydrogen in oxygen was lower. Around stops and restarts, the concentration sometimes rose briefly regardless of voltage. Voltage alone does not tell you about crossover, so log the two separately in long tests, and check gas purity especially just after starts and stops.
Heat and cooling load rise as the stack ages
Whenever cell voltage is above the thermoneutral voltage (1.48 V), the difference turns into heat. In this record, heat generation in the stack nearly doubled, from about 270 W at the start to about 500–550 W later in the run. Over the same period the cooling fan went from around 15% duty to mostly above 75%, and even with the fan at full output there were stretches where the stack inlet stayed above the 40 °C setpoint. Ambient temperature plays a part as well.
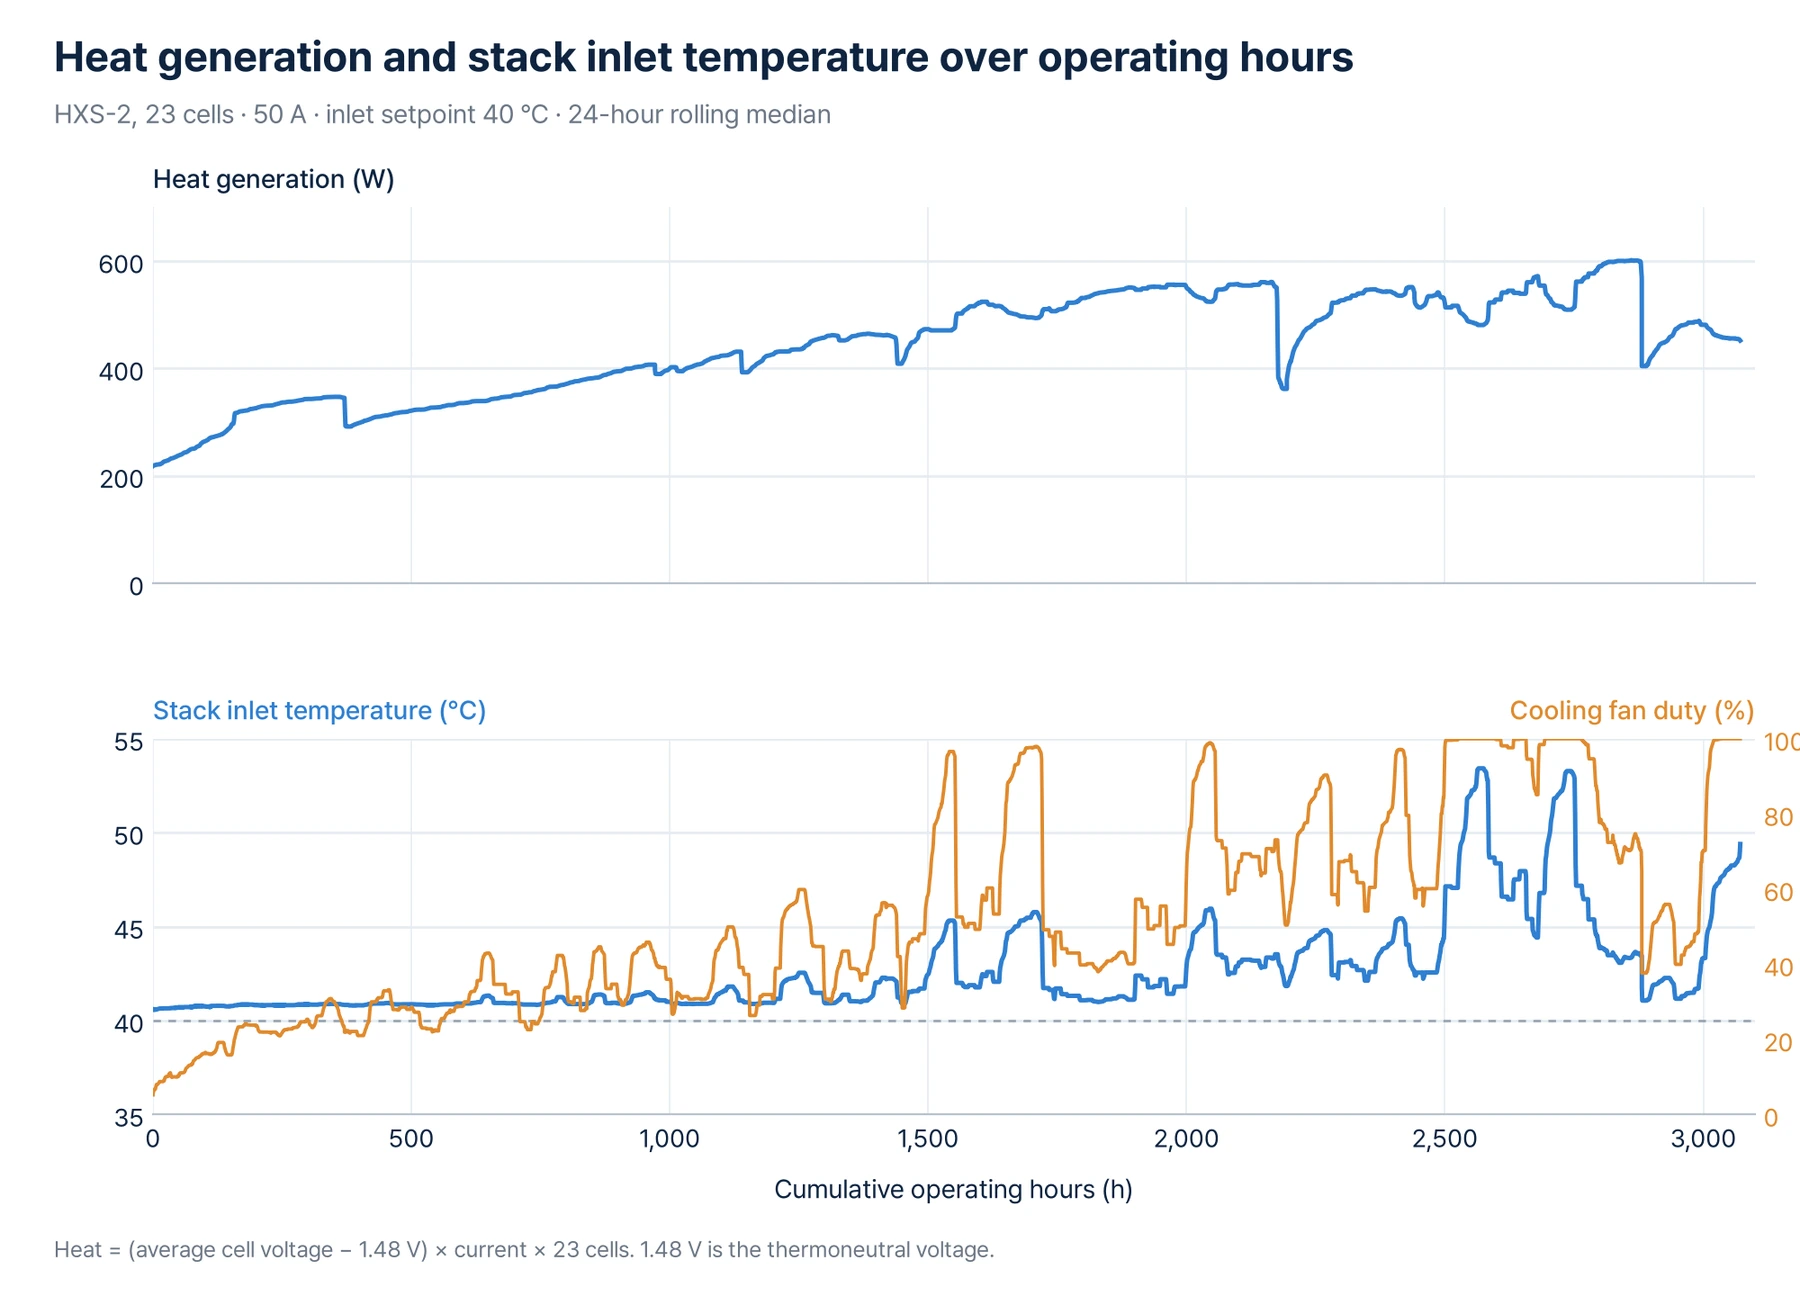
Two points follow. First, size cooling for the cell voltage late in life, not at the start; cooling sized for initial heat generation loses its margin as operating time builds up. Second, a warmer inlet lowers cell voltage. Using the relationship above, an inlet 5 °C warmer reads about 30–40 mV lower per cell. When you read the later part of a long-term curve, look at the temperature log as well, or you will underestimate the real degradation.
What this record can and cannot tell you
| It shows | It does not show |
|---|---|
| More than 3,000 hours of operation under these conditions | A guarantee of 3,000 hours under every condition |
| Operation inside a complete system | A prediction of stack lifetime |
| Voltage and gas purity recorded together | Results at elevated pressure or part load, which need their own tests |
Electrolyzer stacks need to run for tens of thousands of hours in the field. 3,000 hours is what we have verified so far, not a lifetime target. We will keep publishing results under other conditions as they accumulate.
- Reading electrolyzer durability data→Hours, degradation rate and the conditions behind them.
- Why cells and stacks perform differently→What changes when cells are stacked.
Questions to ask when comparing durability records
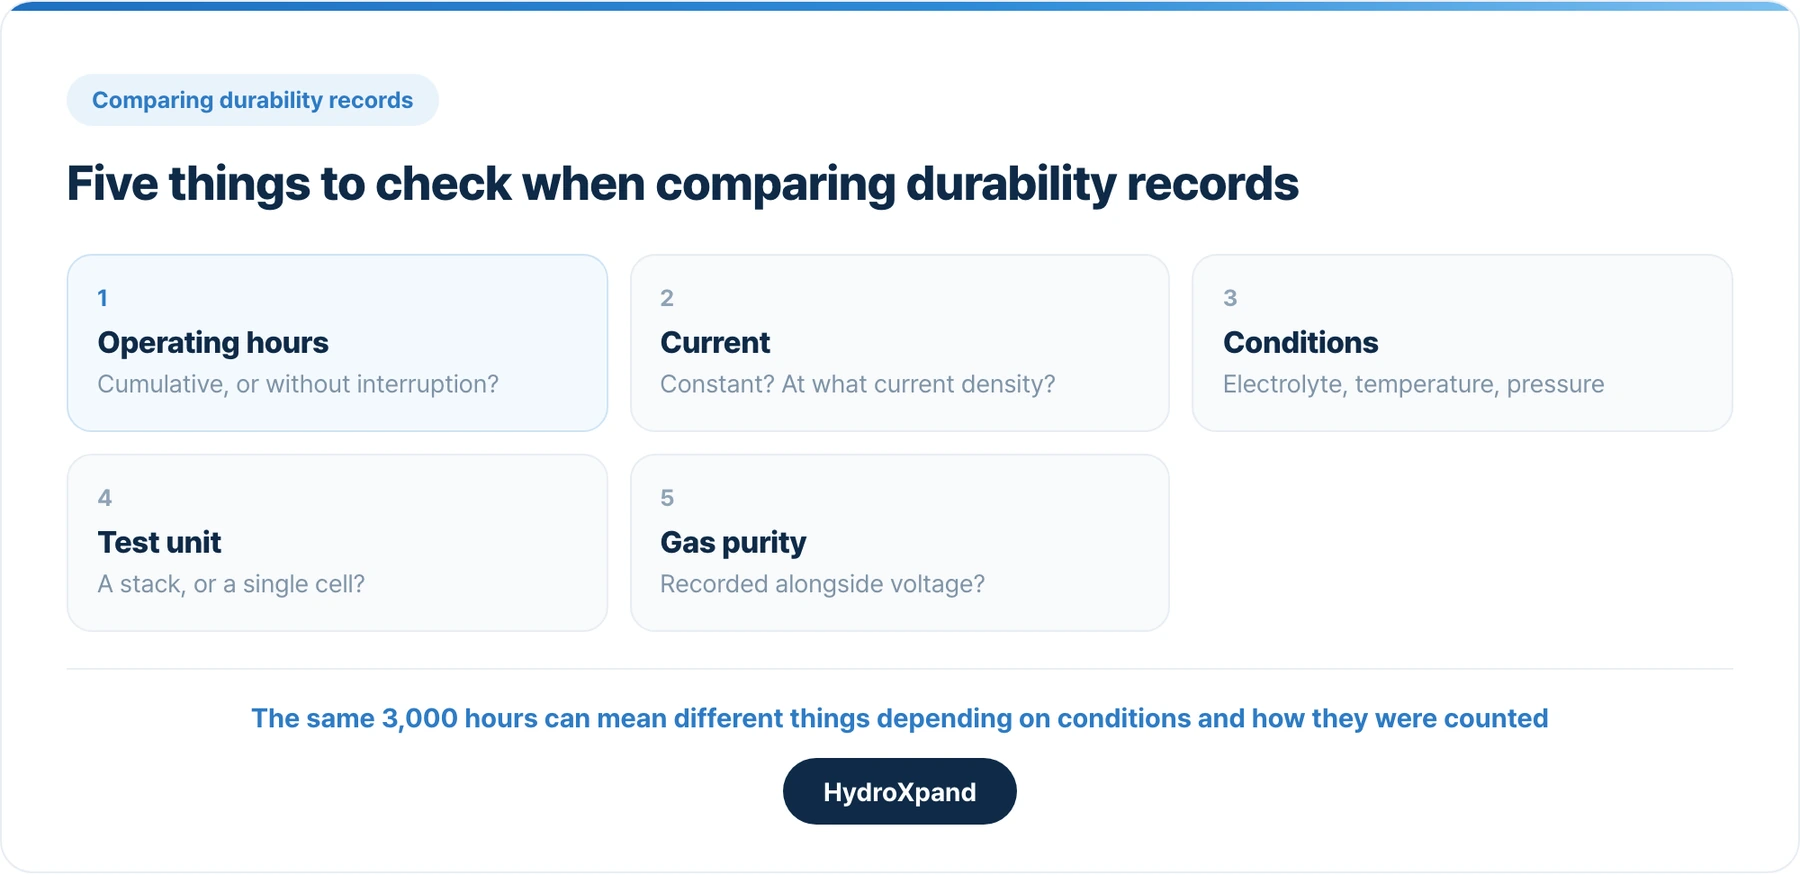
- Are the hours cumulative or without interruption?
- Was the current constant, and at what current density?
- What were the electrolyte concentration, temperature and pressure?
- Is it a stack record or a single-cell record?
- Was gas purity recorded alongside voltage?
If you need more detail on the operating conditions or data for our stack, contact us.
- HXS-2 stack→Specifications and polarisation curve.
Frequently asked questions
Is the 3,000 hours continuous operation?
No. It is cumulative operation: the time with current flowing, added up with stops excluded.
Can 3,000 hours be read as the stack lifetime?
No. It is the operating time verified on one stack under one set of conditions. Field service requires tens of thousands of hours, and lifetime depends on current density, temperature, pressure and how often the stack is started and stopped.
Why does the cell voltage drop after a restart?
AEM cells often restart with part of the loss built up during operation recovered. In this record the voltage returned to its earlier trend over tens to hundreds of hours after each restart, so read the trend within each stretch rather than the value just after a restart.
Do you have records at elevated pressure or part load?
This record is at 50 A and ambient pressure. Results from pressurised operation are in our pressurised-operation note.
Looking at AEM for a specific application?