When a customer contacts us about a fault, the first thing we ask for is the operating record. What to log, how often, what has to be recorded manually, the baseline to capture at commissioning, and how to keep test intervals apart from long-run data.
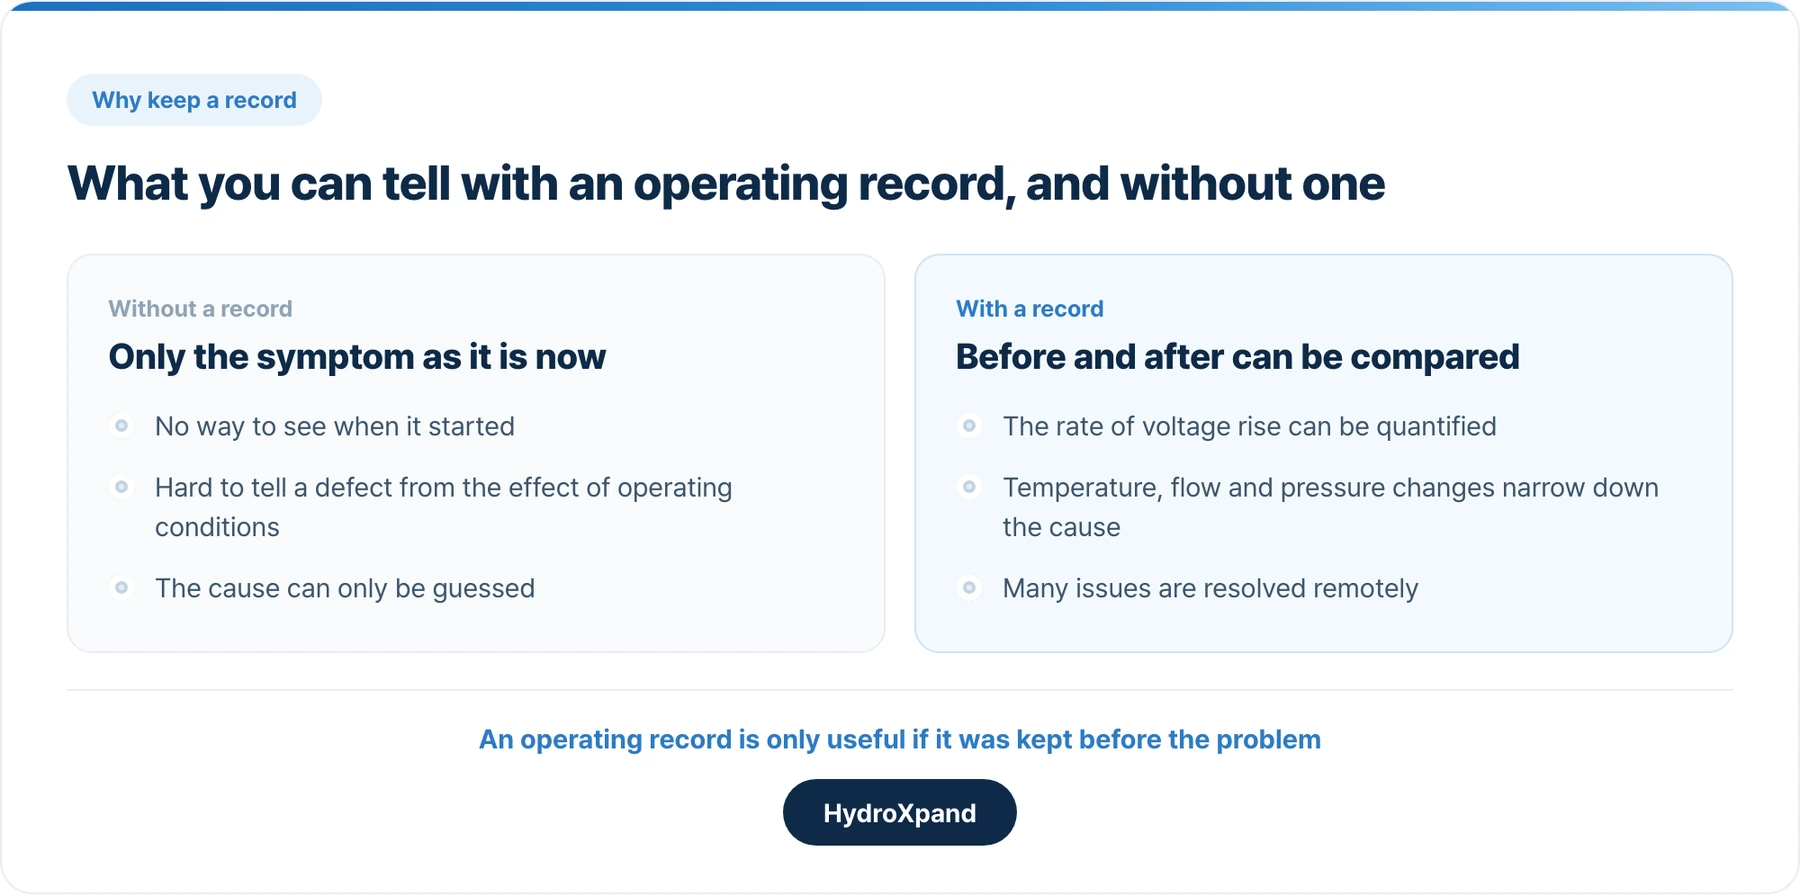
When a customer contacts us about a problem, the first thing we ask for is the operating record. When the cell voltage started to rise, and whether the temperature or flow changed at the same time, can only be seen in a record. Without one we can see the symptom as it is now, and only guess at how it got there.
An operating record is only useful if it was kept before the problem appeared. This is how we keep ours: what to record, how often, and how to store it.
- Capture a baseline at the start. Without the voltage, current, temperature and flow just after commissioning, there is nothing to compare against months later.
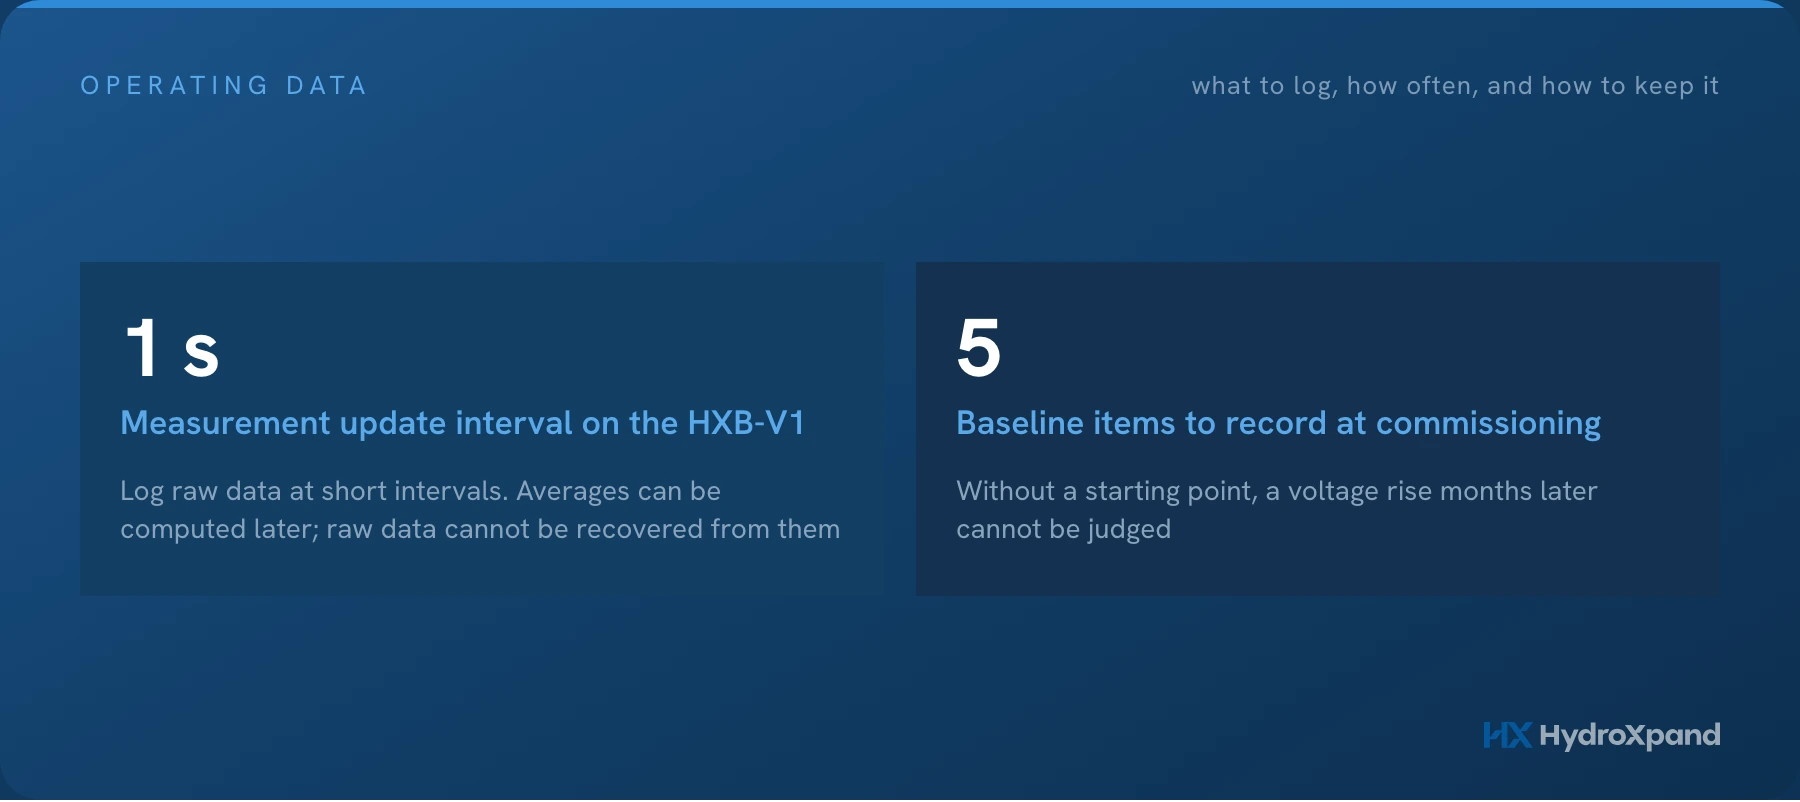
- Log at short intervals and keep the raw data. Averages can always be computed later; raw data cannot be recovered from averages.
- Record manually what the logger cannot. The time and reason for a change of conditions, why the unit stopped, and when the electrolyte was replaced do not appear in an automatic log.
- Keep same-condition intervals separate from test intervals. If test intervals with changed conditions are mixed into a long-run record, performance change becomes hard to read.
Four reasons to keep an operating record
To quantify changes in performance. How fast the cell voltage rises per hour can only be calculated from an unbroken record at the same current.
To find the cause when something goes wrong. Comparing records from before and after the symptoms appeared narrows down what changed, which is also why many issues can be resolved by remote diagnosis.
To handle warranty and service. Whether a fault was present at delivery, or came from operation outside the specification, is judged from the operating record.
To have a reference when you change operating conditions. Trying a different temperature or current only tells you something if the state before the change is in the record.
- Reading electrolyzer durability data→How to read a degradation rate and the window it was fitted over.
- What an electrolyzer warranty covers→Defects, paid service, and what to send when something goes wrong.
What to record
Stack voltage on its own is rarely enough to find a cause. When the voltage rises, you need to see whether the temperature fell or the flow dropped at the same time. These are the measurements we record as a minimum, and why.
| Channel | Why it matters |
|---|---|
| Stack current | Voltage change can only be read as performance change when compared at the same current |
| Stack voltage | Where performance change shows first |
| Individual cell voltages, if measured | Shows when some cells change while the total stack voltage does not |
| Electrolyte inlet and outlet temperature | The same cell runs at a different voltage at a different temperature |
| Electrolyte circulation flow | Lower flow can mean electrolyte no longer reaches every cell evenly |
| Oxygen-side and hydrogen-side pressure | Pressure affects both voltage and gas crossover, the gas from one side passing into the other |
| Hydrogen in oxygen, if an analyser is fitted | Shows whether the concentration stays within the safety limit |
| Make-up water volume and conductivity | Water quality outside the recommended range affects performance and warranty coverage |
| Alarms and events | When, and under what conditions, the unit issued a warning or stopped |
- Why cell voltage distribution matters→What individual cell voltages show that stack voltage does not.
Record the reference along with the value
The same number means different things depending on whether a pressure is gauge or absolute, and whether a temperature was measured at the stack inlet or in the tank. Keep setpoints and measured values apart as well: a 50 °C setpoint does not mean the inlet sits at exactly 50 °C. Note once where each value is measured, so that anyone reading the record later reads it the same way.
How often to record
Use the shortest logging interval you can. Our units update their measurements every second, and we log at one-second intervals ourselves. A long run produces a sizeable file, but storage is rarely the limit.
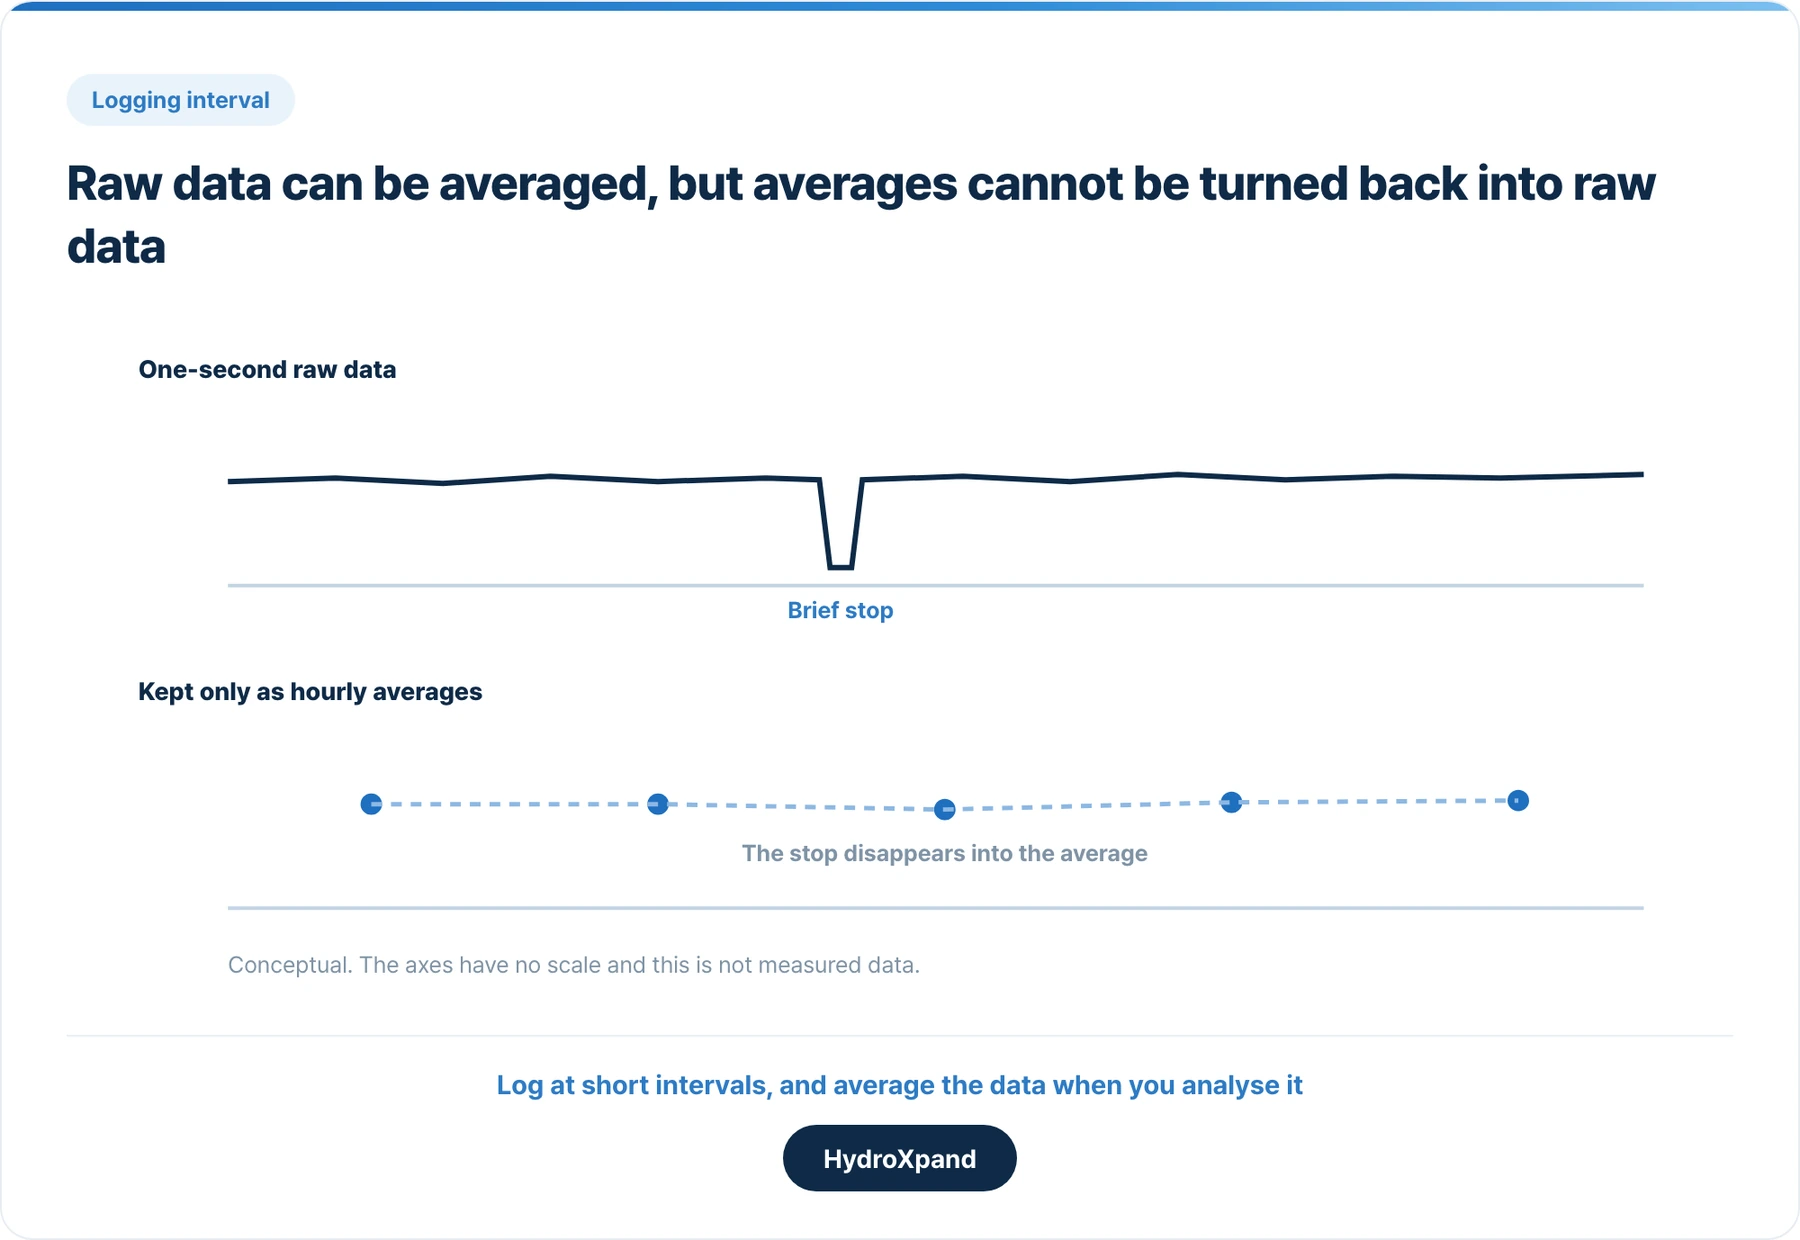
The reason is that raw data cannot be recovered once only averages remain. A one-second record can be reduced to one-minute or one-hour averages at any time, but a record kept only as hourly averages will never show the short stop or brief excursion that happened inside the hour. If you work with averages, keep the raw data as well.
Check for gaps too. If the PC was off or communication dropped, that time is missing from the record. Mark gaps in the record separately from periods when the unit was actually stopped, so the two are not confused later.
Write down what the numbers do not show
An automatic log shows what changed, not why. Alongside it we keep a manually maintained operating log, with:
- The time, the new value and the reason whenever an operating condition is changed
- Stop and restart times, and why the unit stopped
- Electrolyte replacement and top-ups, and maintenance on the water supply
- Parts replaced and inspections carried out
- Anything unusual you noticed: a sound, a trace of leakage, an alarm
Do not fill in what you have not confirmed. If the reason for a stop is unknown, leave it marked as unknown. A guessed entry is later read as fact and can send the search for a cause in the wrong direction.
The baseline to keep at commissioning
To judge whether the voltage has risen months later, you need a starting point. Once the unit is stable after commissioning, record:
- Commissioning date and who carried it out
- Electrolyte specification and the date it was prepared
- Stack voltage and current once stable, with the electrolyte temperature and flow at the time
- How those values compare with the outgoing inspection report
- Any alarms raised during commissioning
If you can, also record a polarisation curve: the voltage at several current steps. Measured again under the same conditions months later, it shows which part of the current range has changed.
Keep same-condition intervals separate from tests
During a long run you will sometimes change current, temperature or pressure to test something. If those intervals stay mixed into the long-run record, you cannot tell whether a voltage rise came from performance loss or from the change of conditions.
We mark the intervals where current and operating conditions stayed the same, and calculate performance change from those intervals only. Test intervals are kept separately rather than deleted. When we quote operating hours, we also say whether they were continuous, without a stop, or cumulative across stops and restarts.
How the HXB-V1 keeps the record
The HXB-V1 is operated from a desktop app on a PC connected over LAN.
| Item | What it does |
|---|---|
| Automatic logging | While the PC is connected and Logging is on, operating data is recorded continuously |
| Update rate | Measurements update once per second |
| Alarms and events | Alarms and operating commands are recorded in Alarms & Events |
| Organising runs | Runs are kept as separate projects in Project Manager. Making commissioning its own project makes it easy to find later |
| Export | Select a project and export it as csv, which opens directly in a spreadsheet or analysis tool |
The standard unit records total stack voltage. If you integrate the unit into your plant through a PLC or SCADA, the control app is not used, so no csv log is generated. In that case, record in your SCADA the measurements available over Modbus TCP, which update every second. We need those records to diagnose any issue.
- Integrating electrolyzer control into your plant→Running one or several units from your own control system.
- HXB-V1 system→The 2 kW system with logging and export built into its control app.
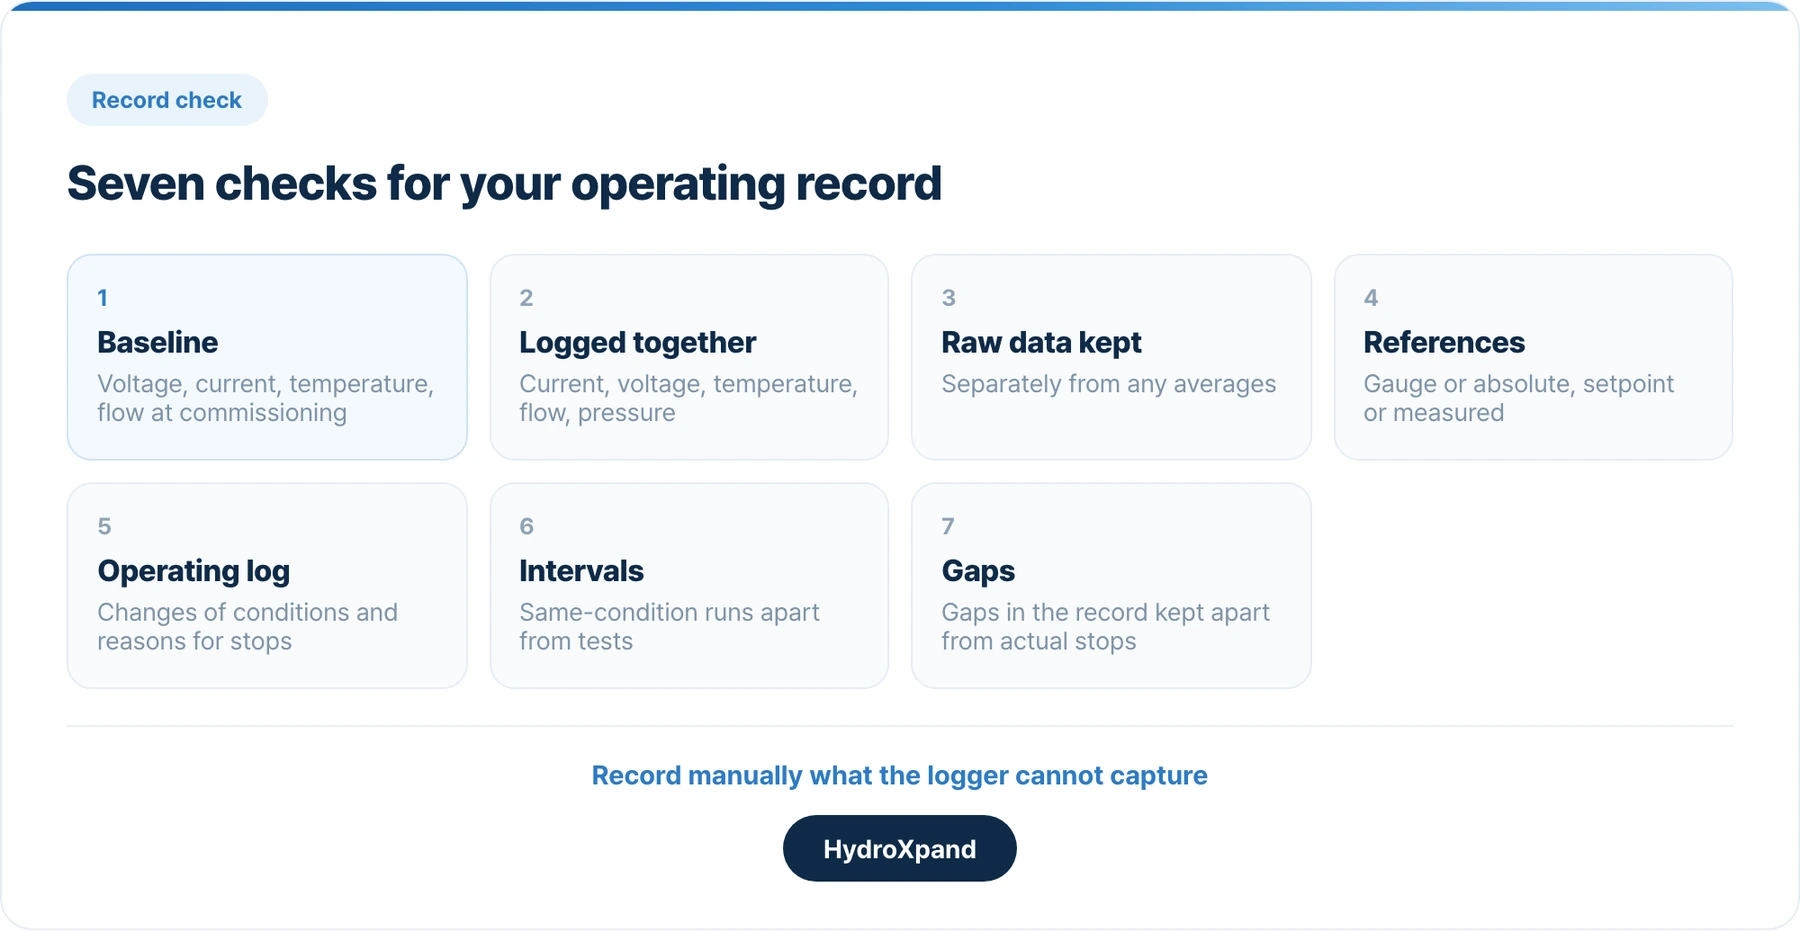
Seven checks for your operating record
- A baseline was recorded just after commissioning
- Current, voltage, temperature, flow and pressure are logged together
- Raw data is kept separately from any averages
- Pressure and temperature references, and setpoints versus measured values, are noted
- Changes of conditions and reasons for stops are written in the operating log
- Intervals with the same conditions are kept apart from test intervals
- Gaps in the record are distinguished from actual stops
- When your test results differ from the datasheet→Seven things to check before comparing your measurement with a reference curve.
Frequently asked questions
Is a one-minute logging interval enough?
One-minute averages are enough to follow a long-term trend. Keeping raw data at one-second intervals lets you check short stops and brief changes later, and averages can always be computed from it.
What should I send if something goes wrong?
The raw operating record for a few days before the symptom and the period after it, together with the operating log for the same period. For an HXB-V1, export the relevant project as csv.
How do I keep a record if the unit is integrated through a PLC?
The control app is not used, so it does not generate a csv log. Record the measurements available over Modbus TCP, which update every second, in your SCADA.
Do I really need a separate operating log?
An automatic log does not record why conditions were changed, why the unit stopped, or when the electrolyte was replaced. Without that, it is hard to tell whether a change in the record comes from operating conditions or from a change in performance.
Looking at AEM for a specific application?